The Bureau of Economic Analysis announced yesterday that U.S. real GDP grew at a 1.9% annual rate in the fourth quarter, well below the historical average of 3.1% per year, but close to the 2.1% average since the recovery from the Great Recession began in 2009:Q3.
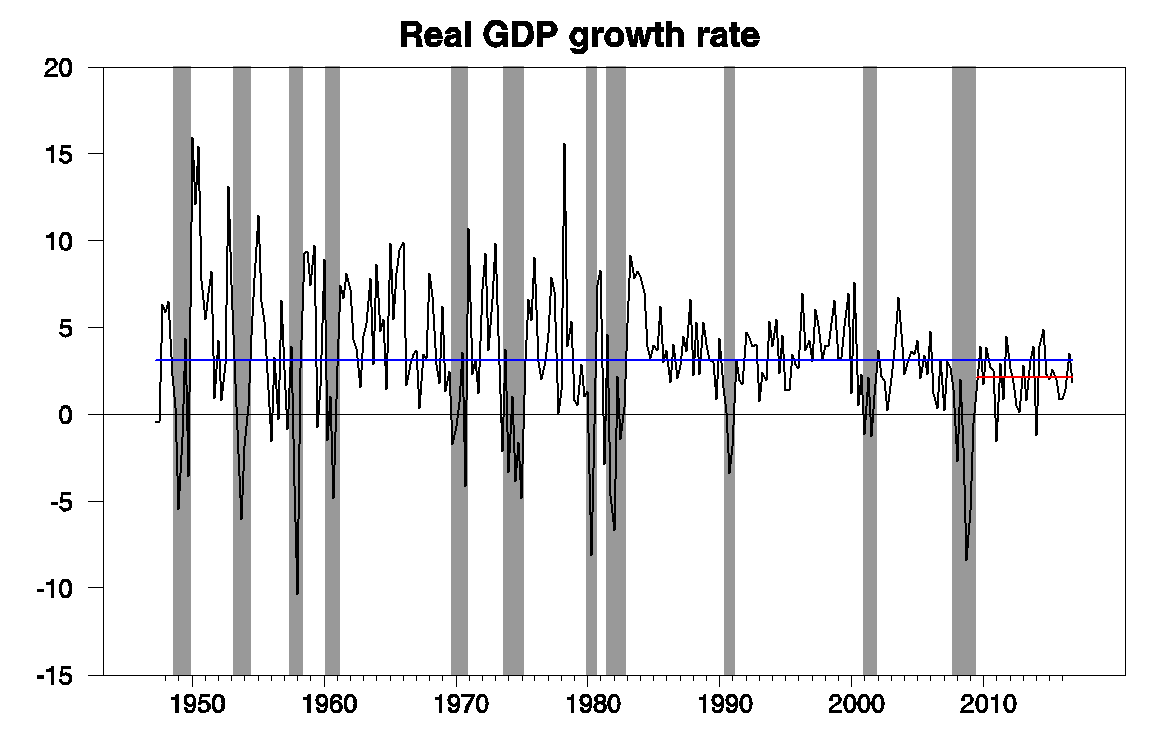
Real GDP growth at an annual rate, 1947:Q2-2016:Q4, with the 1947-2016 historical average (3.1%) in blue and post-Great-Recession average (2.1%) in red.
The ongoing (though modest) growth brought our Econbrowser Recession Indicator Index down to 5.3%, erasing the modest spike up that had followed the weak GDP numbers in the first half of 2016. The index uses yesterday’s release to form a picture of where the economy stood as of the end of 2016:Q3.
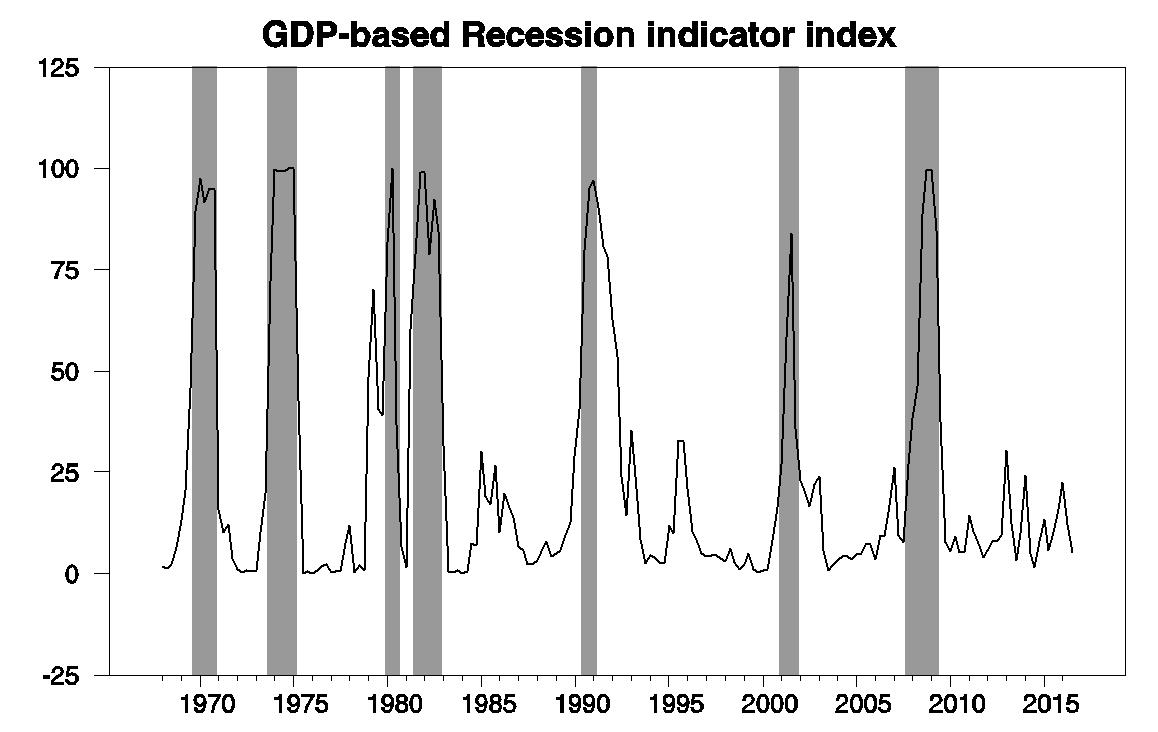
GDP-based recession indicator index. The plotted value for each date is based solely on information as it would have been publicly available and reported as of one quarter after the indicated date, with 2016:Q3 the last date shown on the graph. Shaded regions represent the NBER’s dates for recessions, which dates were not used in any way in constructing the index, and which were sometimes not reported until two years after the date.
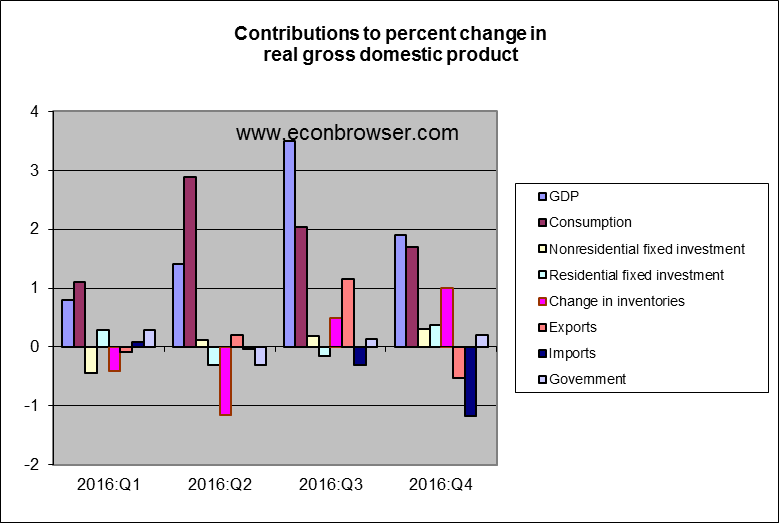
Real consumption spending grew at a 2.5% annual rate in the fourth quarter, a little faster than total GDP. But, as a result in part of the steep appreciation of the dollar, much of the consumption spending went to imported goods. The growth in imports subtracted 1.2% from the GDP growth we would have seen if all the spending had been on domestically produced goods and services. Real exports fell from their high levels of the third quarter. Housing and nonresidential fixed investment made modest positive contributions.
Weak investment spending has been the story for the U.S. for many years now. The fraction of U.S. GDP devoted to investment in nonresidential equipment and structures has been below the historical average every year since the Great Recession.
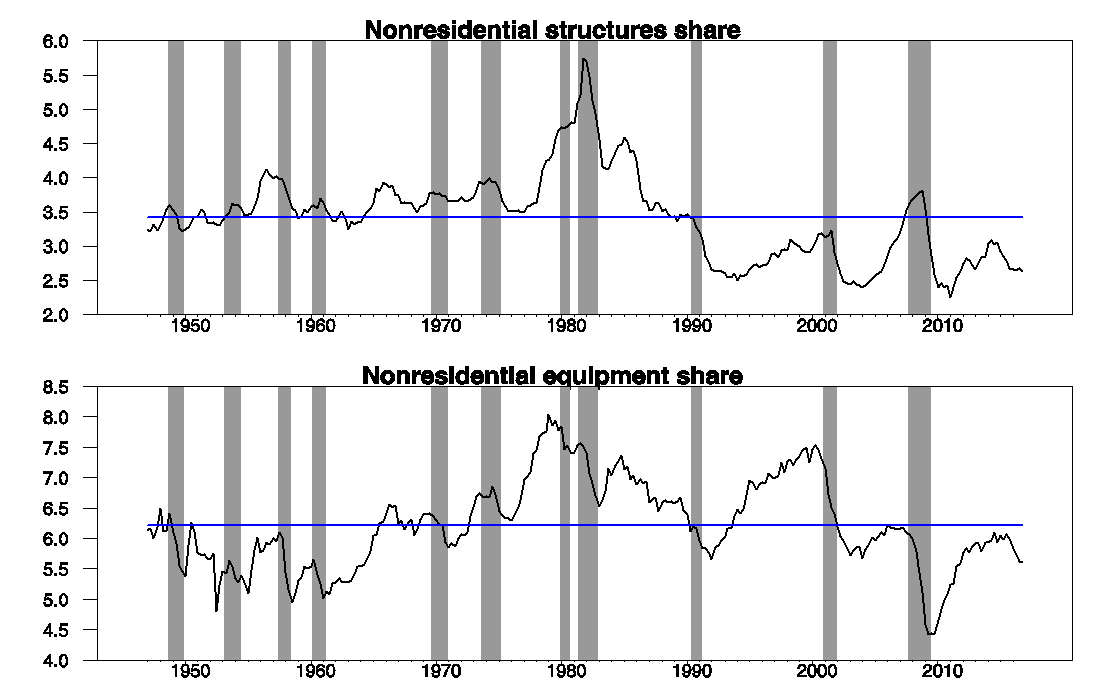
Investment spending as a percent of GDP. Top panel: 100 times the ratio of gross nominal investment in nonresidential structures to nominal GDP. Bottom panel: 100 times the ratio of gross nominal investment in nonresidential equipment to nominal GDP. Data source: BEA Table 1.5.5.
Lower investment spending means not just lower demand for goods and services. Over time it has left us with less productive capital than we would have had if historical trends had continued. There has been a clear slowdown in the rate of growth of the U.S. capital stock since the Great Recession.
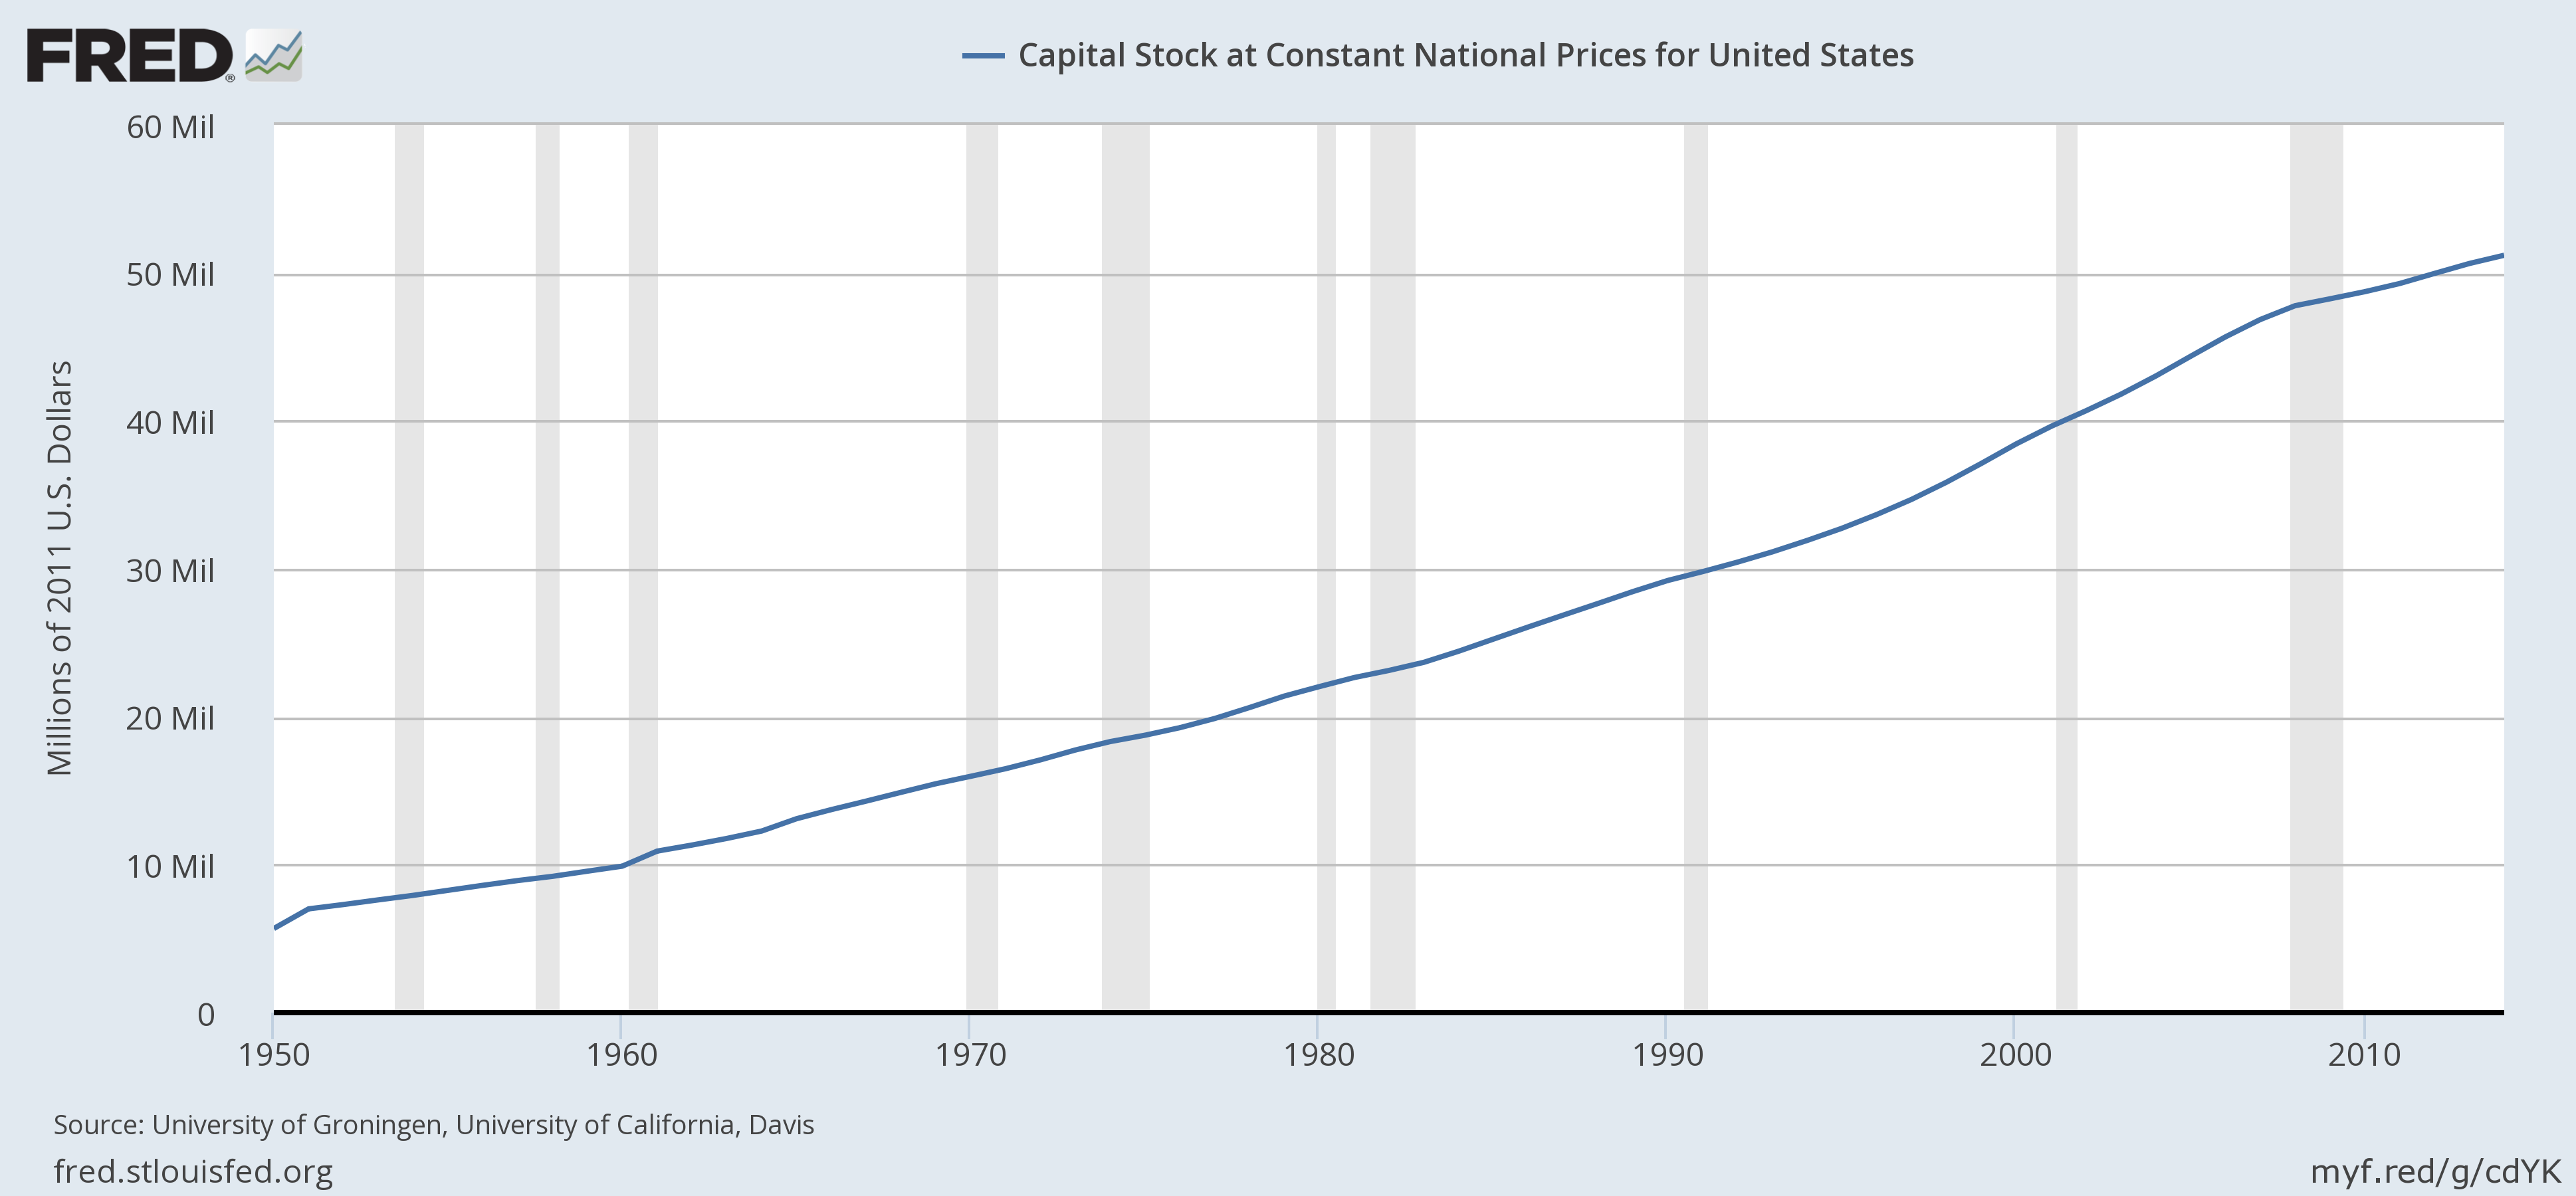
Source: FRED
And slower growth of capital ultimately translates into slower growth of worker productivity. It’s interesting to look at a breakdown of why GDP has grown 1% slower since 2009 than the historical average. Slower growth in employment is a relatively minor factor. Employment has grown at a 1.5% annual growth rate since 2009, compared with the 1.7% since World War II. Instead productivity is the big story. Since the Great Recession ended, labor productivity only grew at a 0.6% annual rate, compared to the 1.4% historical average.
And about half of the meager gains in productivity we did see came in the first few years of the recovery. There has been barely any growth since 2012.
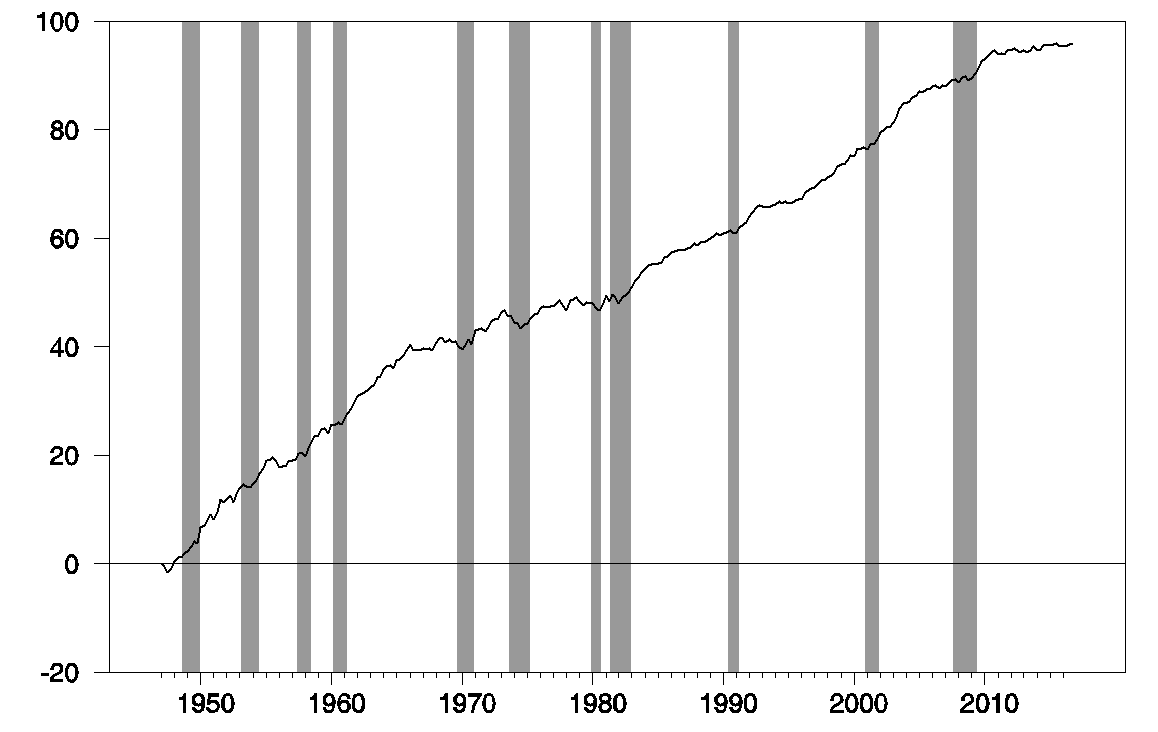
U.S. real GDP per worker, (in logarithms). Values were calculated by taking the natural log of the ratio of real GDP in 2009 dollars to end-of-quarter seasonally adjusted nonfarm payroll employment. Value plotted is 100 times the difference between this number and the corresponding value of 1947:Q1.
There are lots of factors in the long-term slowdown in U.S. investment spending. As we move from brick-and-mortar stores to online sales, we need fewer retail structures. And the surge in business equipment purchases in the 1990s in part reflected a one-time need for every business to computerize. But I’m struck by the fact that the low levels of business fixed investment are mirrored by low spending on new home construction and autos, two consumer-based components of GDP that historically usually exhibit similar cyclical dynamics to nonresidential fixed investment.
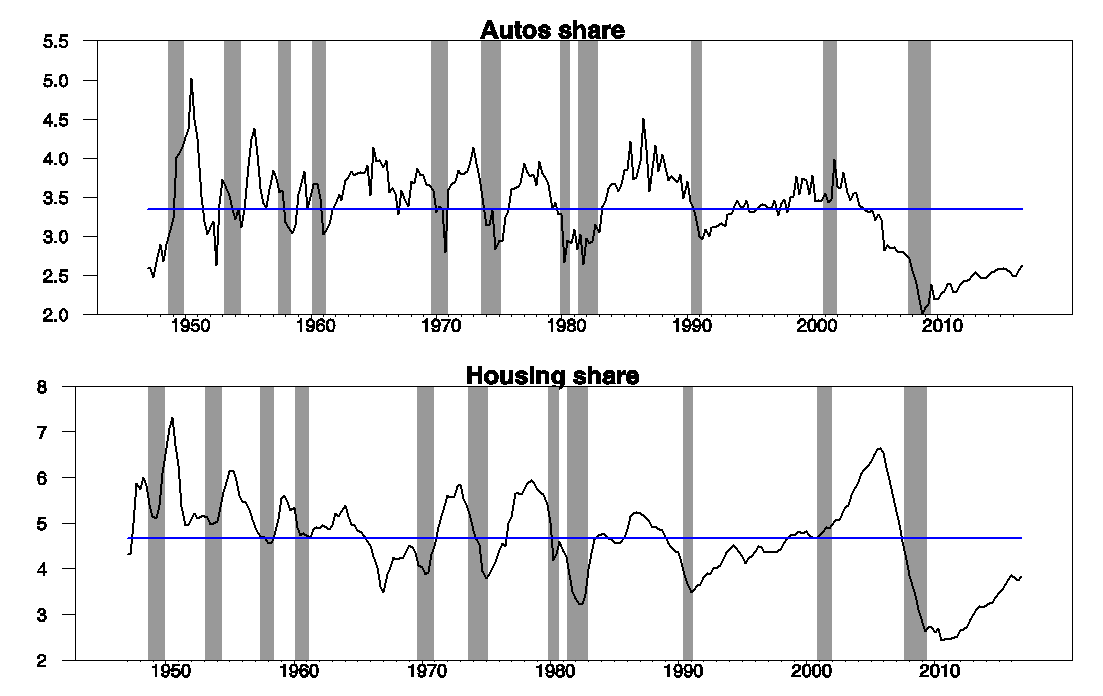
Autos and housing as a percent of GDP. Top panel: 100 times the ratio of nominal spending on motor vehicles and parts to nominal GDP. Bottom panel: 100 times the ratio of gross nominal nonresidential fixed investment nominal GDP. Data source: BEA Table 1.5.5.
Business investment, housing construction, and auto purchases are categories of spending have always been very vulnerable to cyclical downturns. They’re the prime target when firms and consumers feel they need to cut spending and are apprehensive about the future. In many ways, what we saw over 2009-2016 was that typical cyclical behavior continue for a very untypically long period.
If business and consumer confidence in future income growth were to return, we could easily see stronger U.S. economic growth over the next several years than we have over the last eight.
Business investment in new, more productive plants and equipment has been lethargic because demand has been weak. Why would businesses invest in new production when capacity utilization is far below average?
Just hire more workers to meet any increase in demand and then fire them if demand falters. Makes way more sense to invest in buying back stock and raising EPS to increase the value of your stock options.
Yes, fuel for financial asset trading marketplaces makes even more sense when you realize that tax cuts give you even more speculative abilities without having to earn it through real investments, you know, the ones that require labor, materials, equipment, and marketing and selling efforts to produce real earnings in a real market.
Of course we want real investments not political power expressions that pander away with tax grants to the trading class of people. Can they not earn their largess like they did before all the tax cutting lowered rates below any comparable society’s? And that is the point to me, thus group has learned that they can use self government to redistribute wealth, power and control over future income flows – upward to themselves.
The world of earning has been turned upside down. The financial crisis just demonstrated this in remarkable ways too as truly unreal, uneconomic leveraged financial asset trading was bailed out.
Lower spending on nonresidential structures isn’t necessarily a bad thing. America has a huge oversupply of commercial space, with 10 times as much per person as Germany, and to top it off a lot of retail is transitioning to the internet. Office vacancy rates are high too – this has been generally true since the Clinton boom ended, but I don’t think there’s an economic need for 15% office vacancies. Not building see-through office towers and empty malls is a good thing.
Per capita real GDP is now 10% below a long-run trend (chart below). I think, less regulation, lower business taxes, and a higher minimum wage (i.e. shifting production costs) will spur growth.
https://www.advisorperspectives.com/dshort/updates/2017/01/27/q4-real-gdp-per-capita-1-03-versus-the-1-87-headline-real-gdp
So no need to increase demand? Really?
A higher minimum wage will attract labor and raise productivity.
High compensation costs, too many regulations, and excessive corporate or middle class taxes (all on the production side), along with a surplus of low-skilled labor, may explain much of the decline in real wages.
lol, you mean the opposite. typical gliber.
Employment has grown at a 1.5% annual growth rate since 2009, compared with the 1.7% since World War II. Instead productivity is the big story. Since the Great Recession ended, labor productivity only grew at a 0.6% annual rate, compared to the 1.4% historical average.
This is true. It’s also true in just about every advanced economy. US labor productivity growth looks downright Herculean compared to Britain. So something’s going on here that is not peculiar to any one country’s policies. Three things jump out as possible candidates. The first is a global rise in income inequality. People tend to work up to or down to what they perceive as a fair wage. Slightly overpay a worker and that worker is likely to step up his or her performance. Underpay that worker and he or she will be inclined to shirk. Second, a leveling off of educational achievement. Finally, there’s growing evidence that innovation comes disproportionately from newer and smaller firms. Big old stodgy companies tend to overpay their executives and underperform in terms of innovation.
Slow growth is caused by globalization – period. Wage stagnation and rising inequality also have the same cause. The reason I assert that is because I accept basic economic theory. It is only because most economists are ideologically committed to free trade they cannot to accept the simple microeconomics of global integration. It is really quite bizarre that economists reject their own theory in this regard. Perhaps this needs a name – call it “theory denial”. It would be the same if climate scientists rejected climate change for political reasons.
If economists support running open economies then they should have the good grace to explain what that might mean for ordinary working men and women.
Maybe, maybe not. It is also possible governments methods of “growth extraction” are outdated.
This is the best article and comments I’ve read in in a long time. I also think that Floxo makes some of the most important points. We need to restructure globalism to benefit more democratic countries before you can restore any confidence.
“In many ways, what we saw over 2009-2016 was that typical cyclical behavior continue for a very untypically long period.”
In fact there is potential that Trump’s plan to stimulate growth could work.
The point is: mercantilism has its downsides too (esp. as China owns the US) and Adam Smith plus Davis Hume know a lot about that. As I remember, and please correct me James in case I am wrong, in “The Wealth of Nations”, Adam Smith criticised the implicit political corruption of mercantilism in limiting the benefits of trade to the elite classes. Oh yes, Wilbur Ross, I think I know what is on your mind …
I’m surprised at how long it is taking for the realization to sink in that technology is displacing workers at a faster rate. I may have missed something here, but there doesn’t seem to be any mention of the participation-rate, and that would then also need some attached considerations regarding job quality factors and etc. But of course we just slogged through an election cycle rife with the usual lies, and so it may take a while for the dust to clear, perhaps then we will dust off the Luddite doomspeak pages and start talking about potential solutions.
Sorry, but consumer spending grew faster than that in the 4th quarter and as a result, inventory growth was faster. This means GDP growth was faster.
This is the same mistake made in the last quarter and will have to be corrected in the future.
I’m a bit surprised we haven’t seen any tweets about how imports are absolutely destroying GDP growth.
“And about half of the meager gains in productivity we did see came in the first few years of the recovery. There has been barely any growth since 2012.”
Just a small, technical cautionary note about putting much weight on recent productivity growth figures.
Productivity growth numbers are among the most heavily-revised series that macroeconomists use. Even 5-year average growth rates for the U.S. are heavily revised and commonly have revisions roughly as large as the original published estimates. That means that the recent data could be quite consistent with productivity growth at the post-war average. Or a serious collapse in productivity growth.
If you’d like to see documentation of this fact, see http://dx.doi.org/10.1016/j.jmacro.2015.11.004
Simon van Norden: The productivity number I plot here is just an accounting identity, namely the ratio of real GDP to nonfarm payroll employment.
James:
Yes.
And an unreliable one.
In the sense that that official number 5-10 years from now may look quite different from the one that you are analyzing.
And in the sense that the three productivity numbers you offer in your table are not as comparable as readers may think they are.