The Bureau of Economic Analysis announced today that seasonally adjusted U.S. real GDP was 9.5% lower in the second quarter than it had been in the first quarter, which they reported as a decline at an annual rate of 32.9% (0.9054 – 1 = -0.329). That is four times as large a quarterly decline as anything since the BEA began reporting quarterly GDP in 1947, and represents a 10 sigma (10 standard deviations) event.
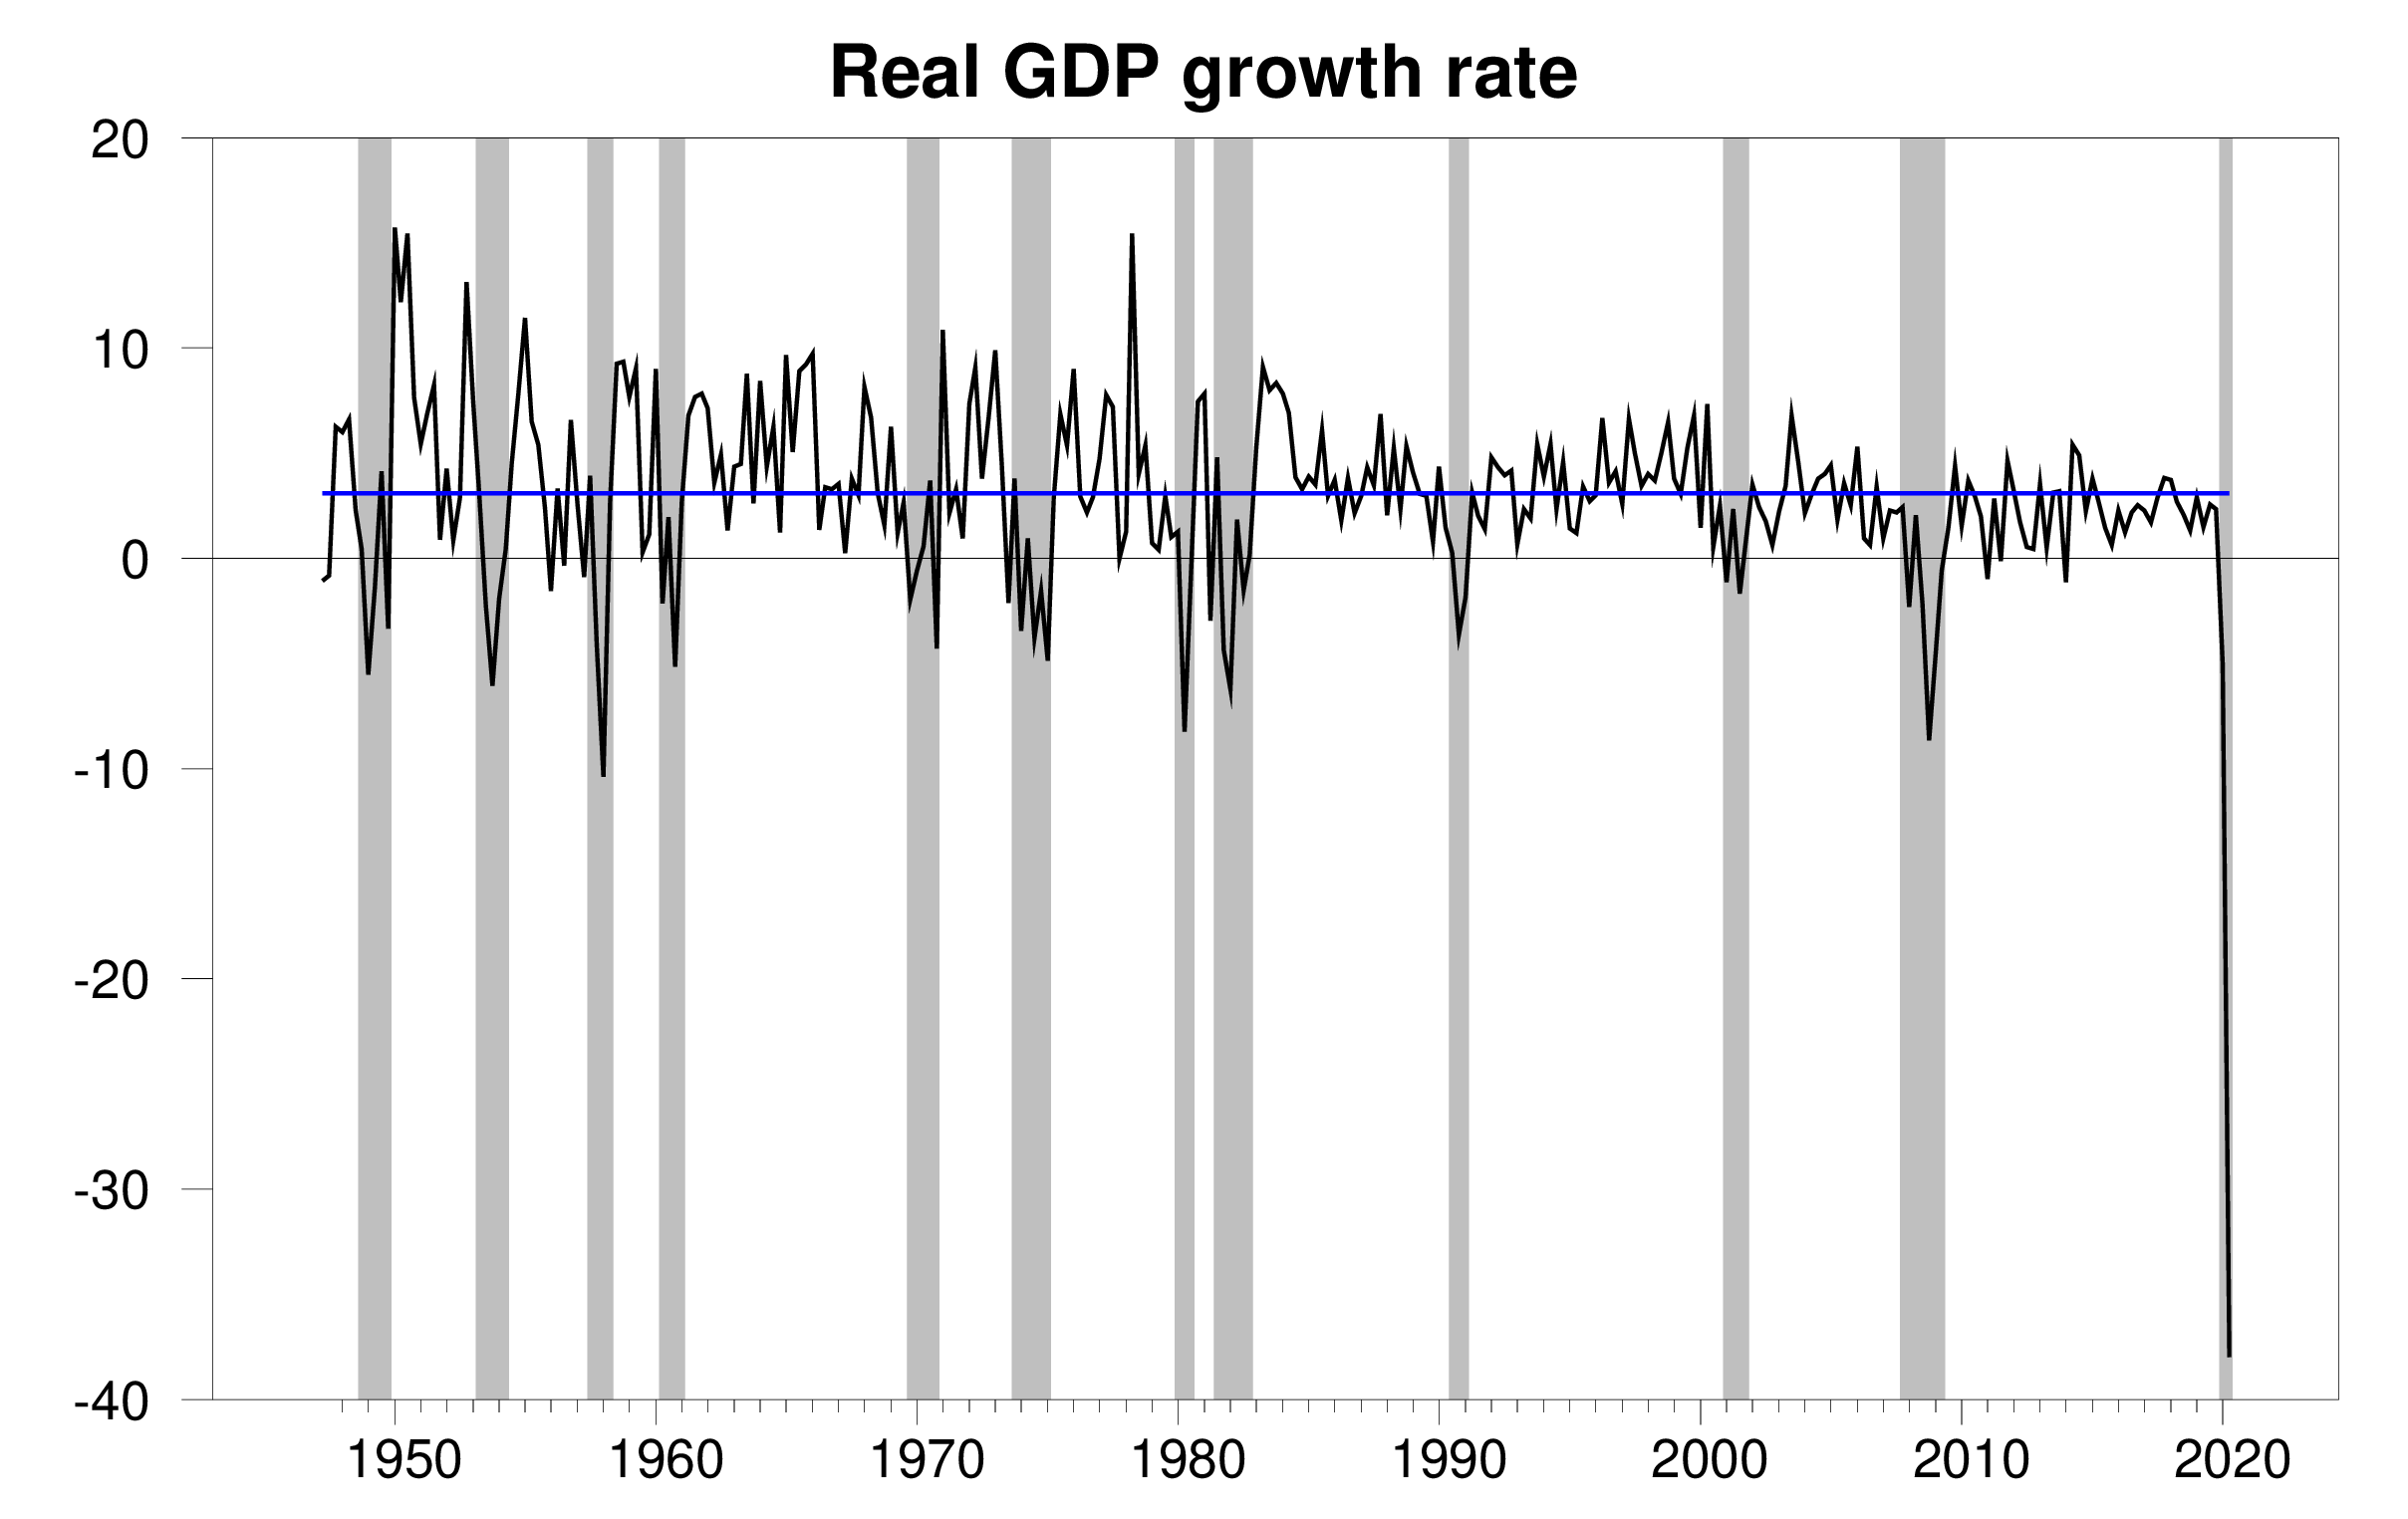
Real GDP growth at an annual rate, 1947:Q2-2020:Q2, with the 1947-2019 historical average (3.1%) in blue.
I’ve been reporting a GDP-based recession indicator index each quarter since we started the blog in 2005. What I’ve been doing up to this point is re-estimating the parameters of the model (the numbers that describe what happens in a typical expansion or a typical recession) every time a new GDP observation gets released. If you try that with the data set from 1947:Q2 through 2020:Q2, the latest drop is so dramatic that the maximum likelihood estimates would put 2020:Q2 in a class all by itself, a severe recession unlike anything seen previously. What I have done to keep the index going is to fix parameters at the values estimated as of 2020:Q1 and interpret the 2020:Q2 data from the perspective of the historically observed patterns. This calculation results in a value for our recession indicator index for 2020:Q1 of 97.1. In other words, based on the historical record of GDP growth, the current numbers would lead us to conclude that there is a 97.1% probability that the twelfth postwar recession in the United States began in the first quarter of this year. This is not surprisingly the same conclusion that the Business Cycle Dating Committee of the National Bureau of Economic Research reached on June 8. The NBER declaration is a judgmental interpretation, whereas our index is a purely mechanical summary of the GDP data alone. As usual, the two approaches reach a very similar conclusion, though ours needed to see the 2020:Q2 GDP release to be able to make a definitive call.
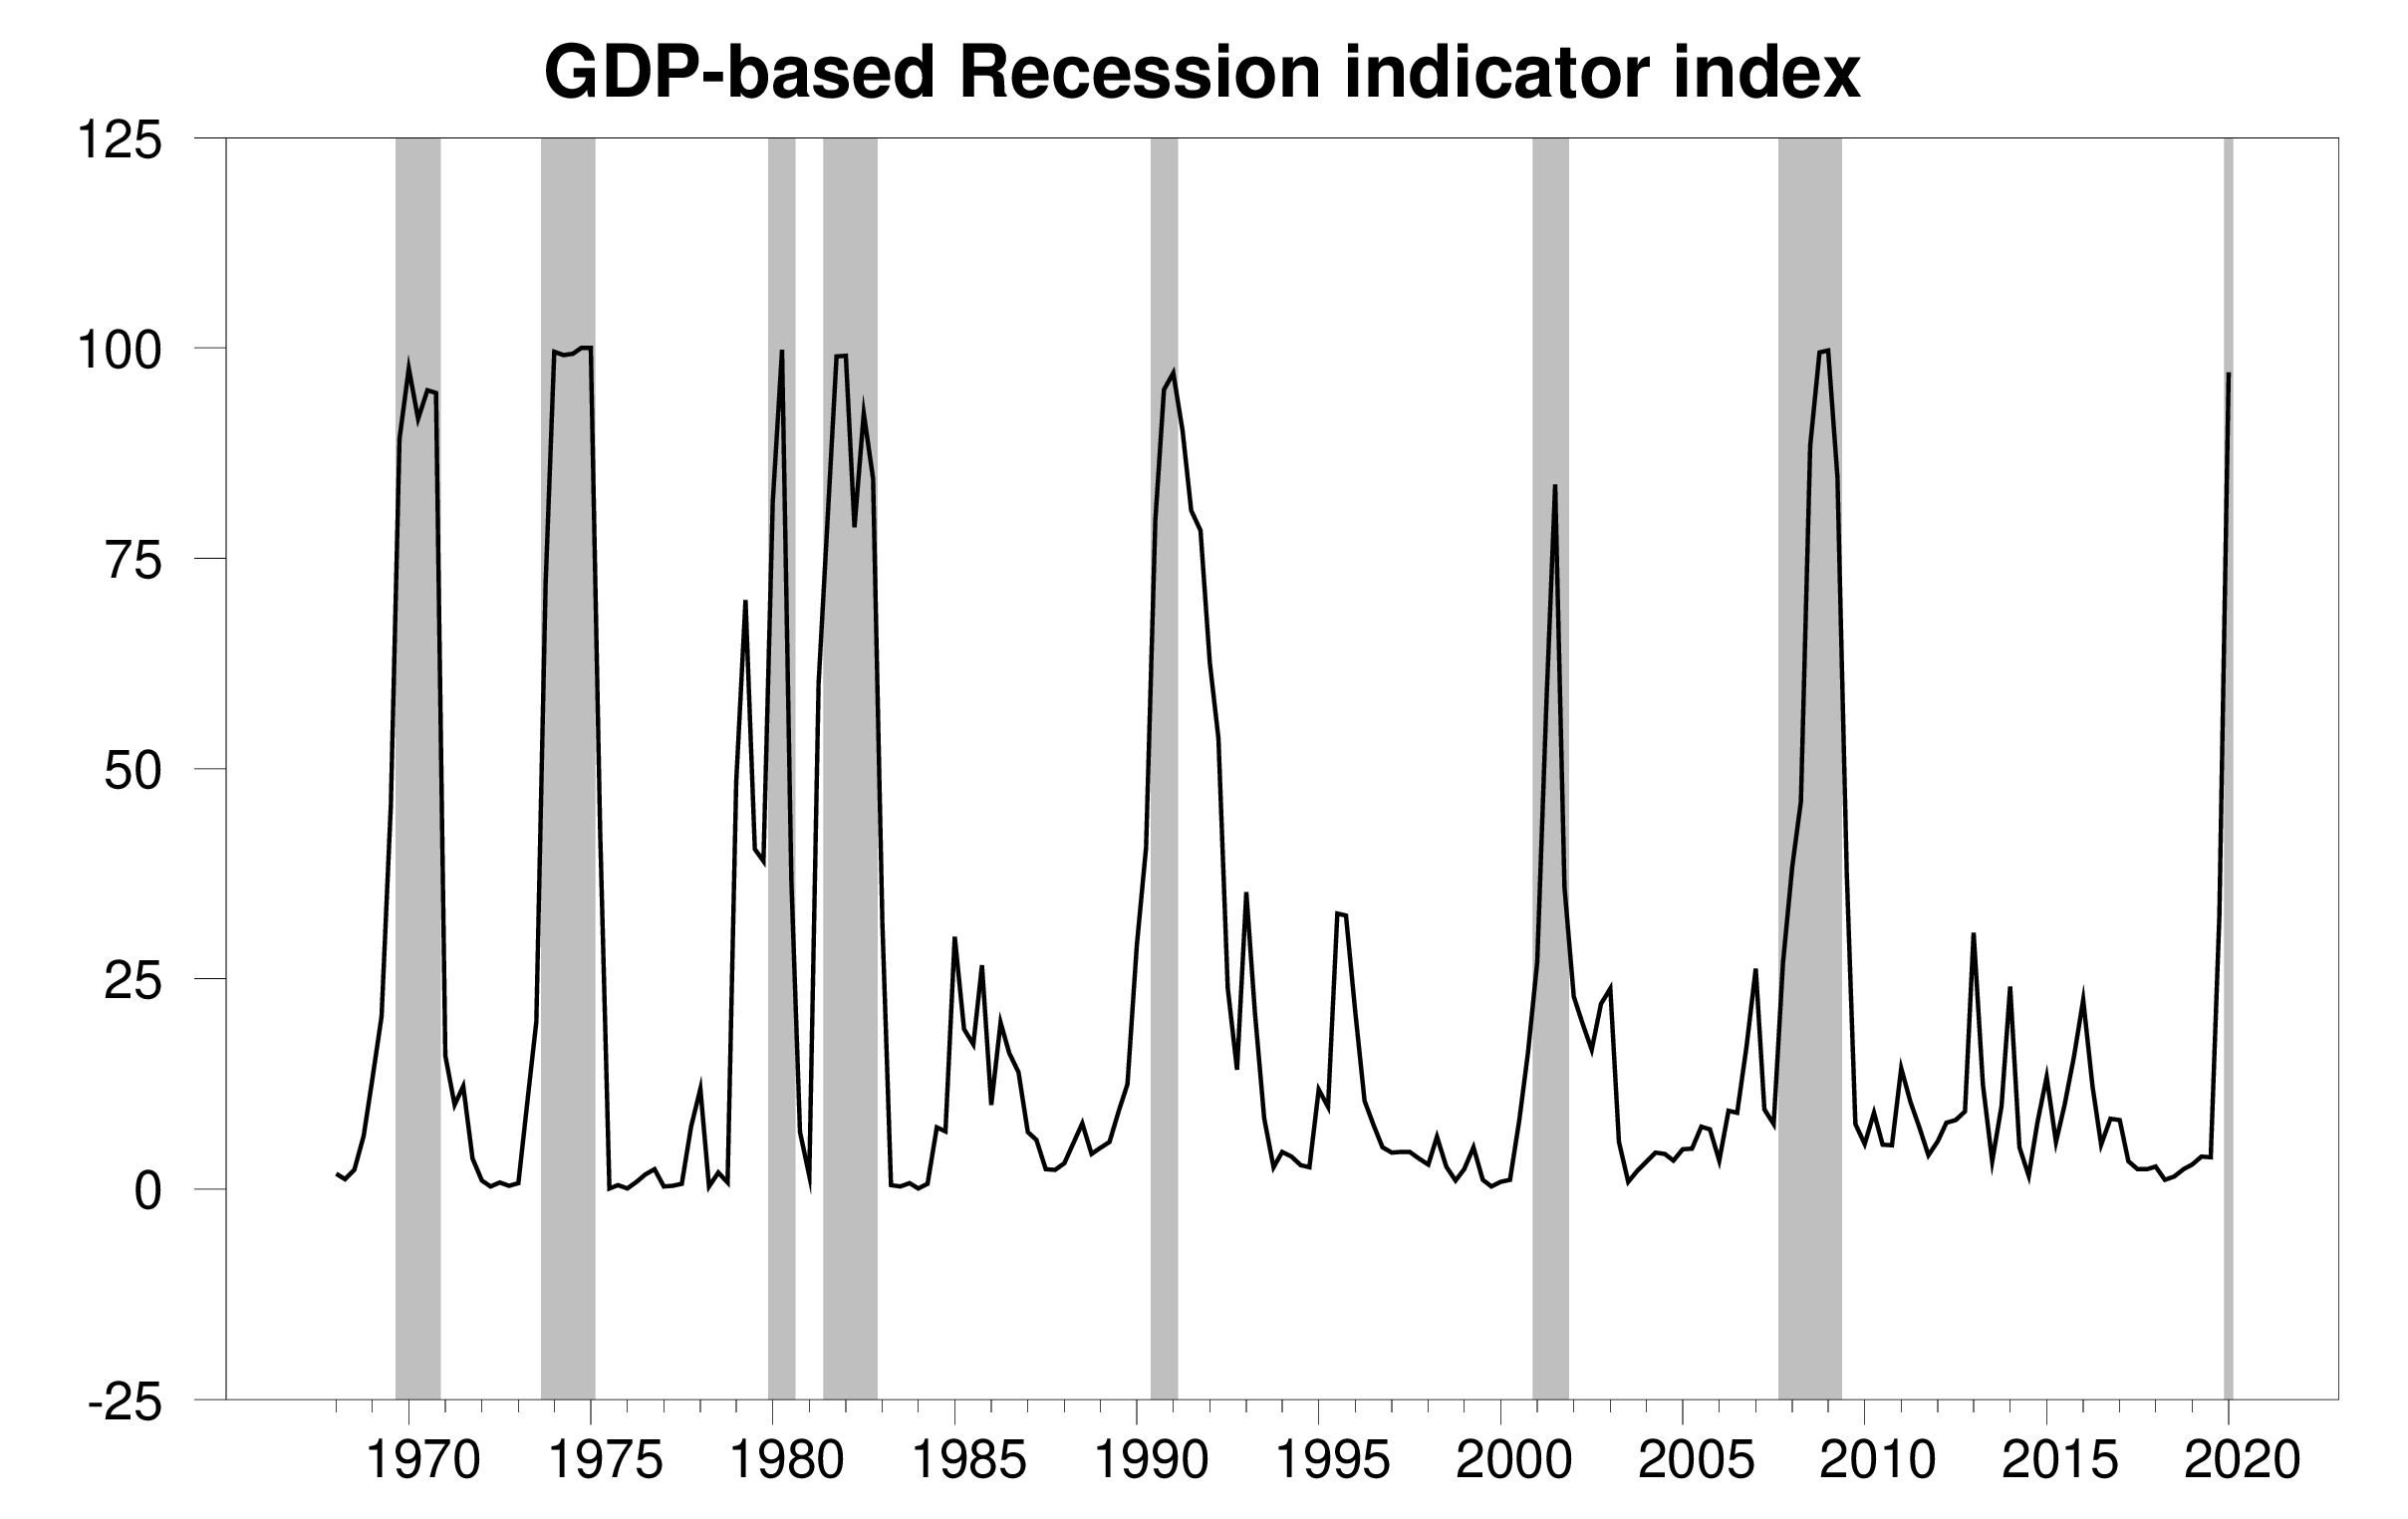
GDP-based recession indicator index. The plotted value for each date is based solely on the GDP numbers that were publicly available as of one quarter after the indicated date, with 2020:Q1 the last date shown on the graph. Shaded regions represent the NBER’s dates for recessions, which dates were not used in any way in constructing the index.
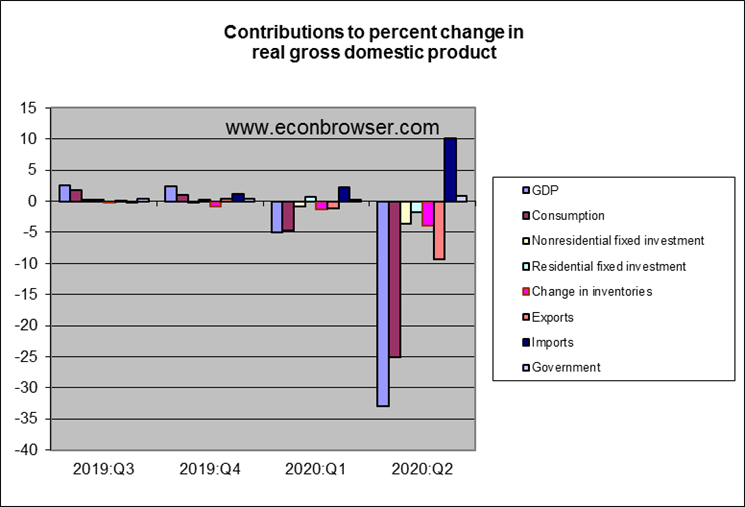
The drop was across the board in terms of the traditional components of GDP. Consumption spending was the single biggest factor in the drop, offset a bit by the fact that a significant part of the lower consumption spending came in the form of lower spending on imported goods. But even if consumption and imports had held constant, lower fixed investment alone would have led to a -5% annual GDP growth rate, and lower exports by itself would have produced a GDP annual growth rate of -10%.
It’s also helpful to break down the consumption spending. Spending on consumer services accounts for 47% of GDP. Service spending is usually quite stable even in severe recessions, while durable spending takes the brunt of the cutback. Not so this time. Durable spending was about the same in Q2 as in Q1, while services fell 43.5% at an annual rate.

Black: percent change in real personal consumption expenditures on services. Blue: percent change in real personal consumption expenditures on durables. Both growth rates are reported at an annual rate.
Investment spending is usually the biggest factor in a typical recession. The drop in residential and nonresidential fixed investment this time is similar in absolute size to what we see in other recessions. It only looks small in the graphs above in comparison to what happened to services consumption.
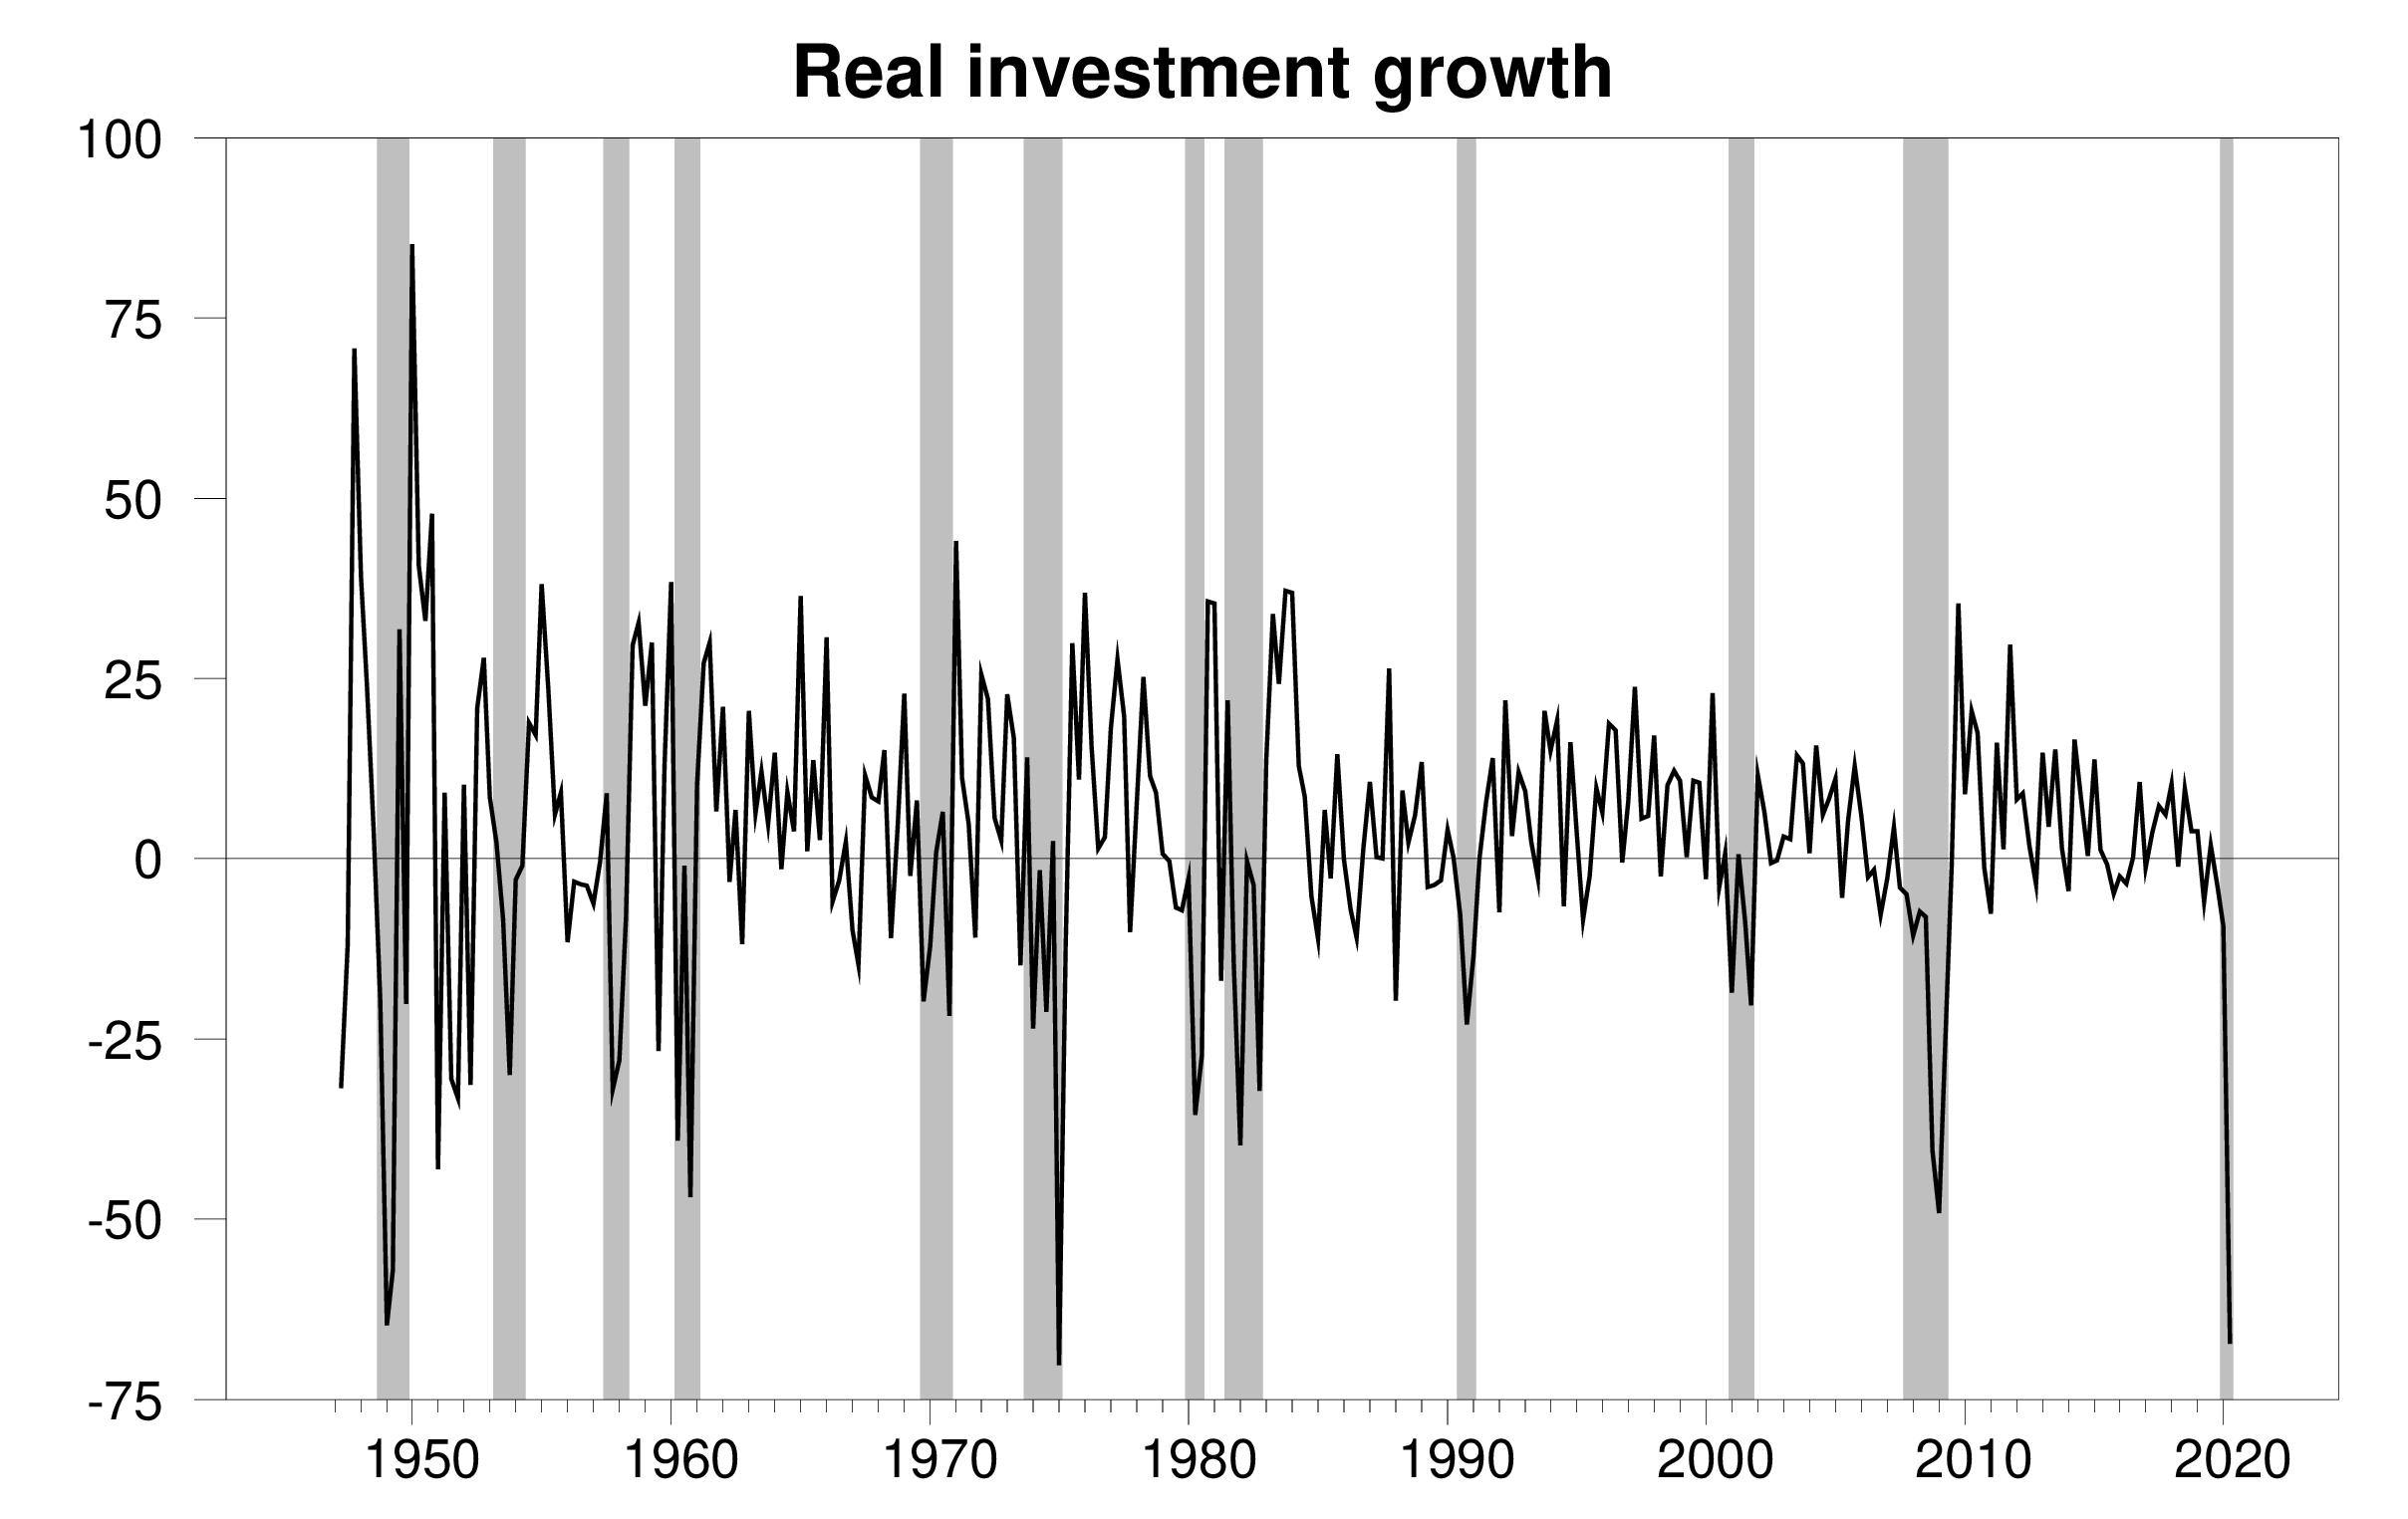
Percent change in real investment spending at an annual rate.
The biggest single factor in lower services spending was health care, as people stayed away from doctors, dentists and hospitals as much as possible. That presumably will rebound. But other categories of spending, such as restaurants, hotels, recreation, and air travel could take quite a while to recover.
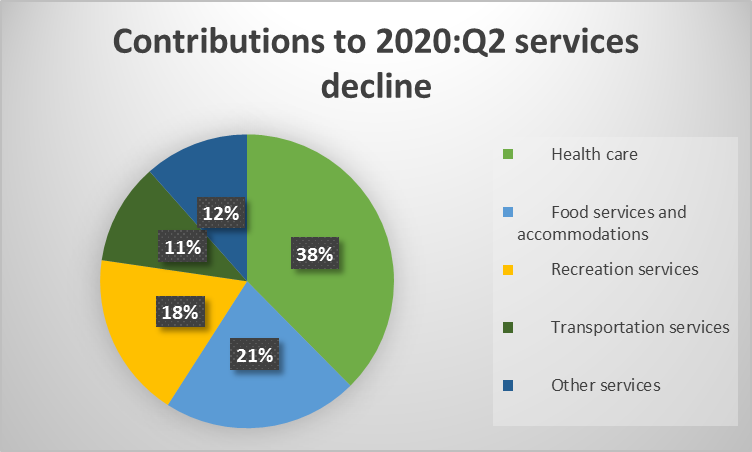
Contributions of different categories to 2020:Q2 drop in real spending on consumer services. Data source: BEA Table 2.3.2.
Where do we go from here? The increase in the unemployment rate in April was the biggest increase on record. But the drop in June was also the biggest decrease on record. I would not be surprised to see something similar with GDP. Almost mechanically, real GDP in the third quarter has to be a bigger number than the second quarter. So, we may have seen the bottom, at least as far as GDP is concerned. But it could be a long time before we’re looking out over the top again.
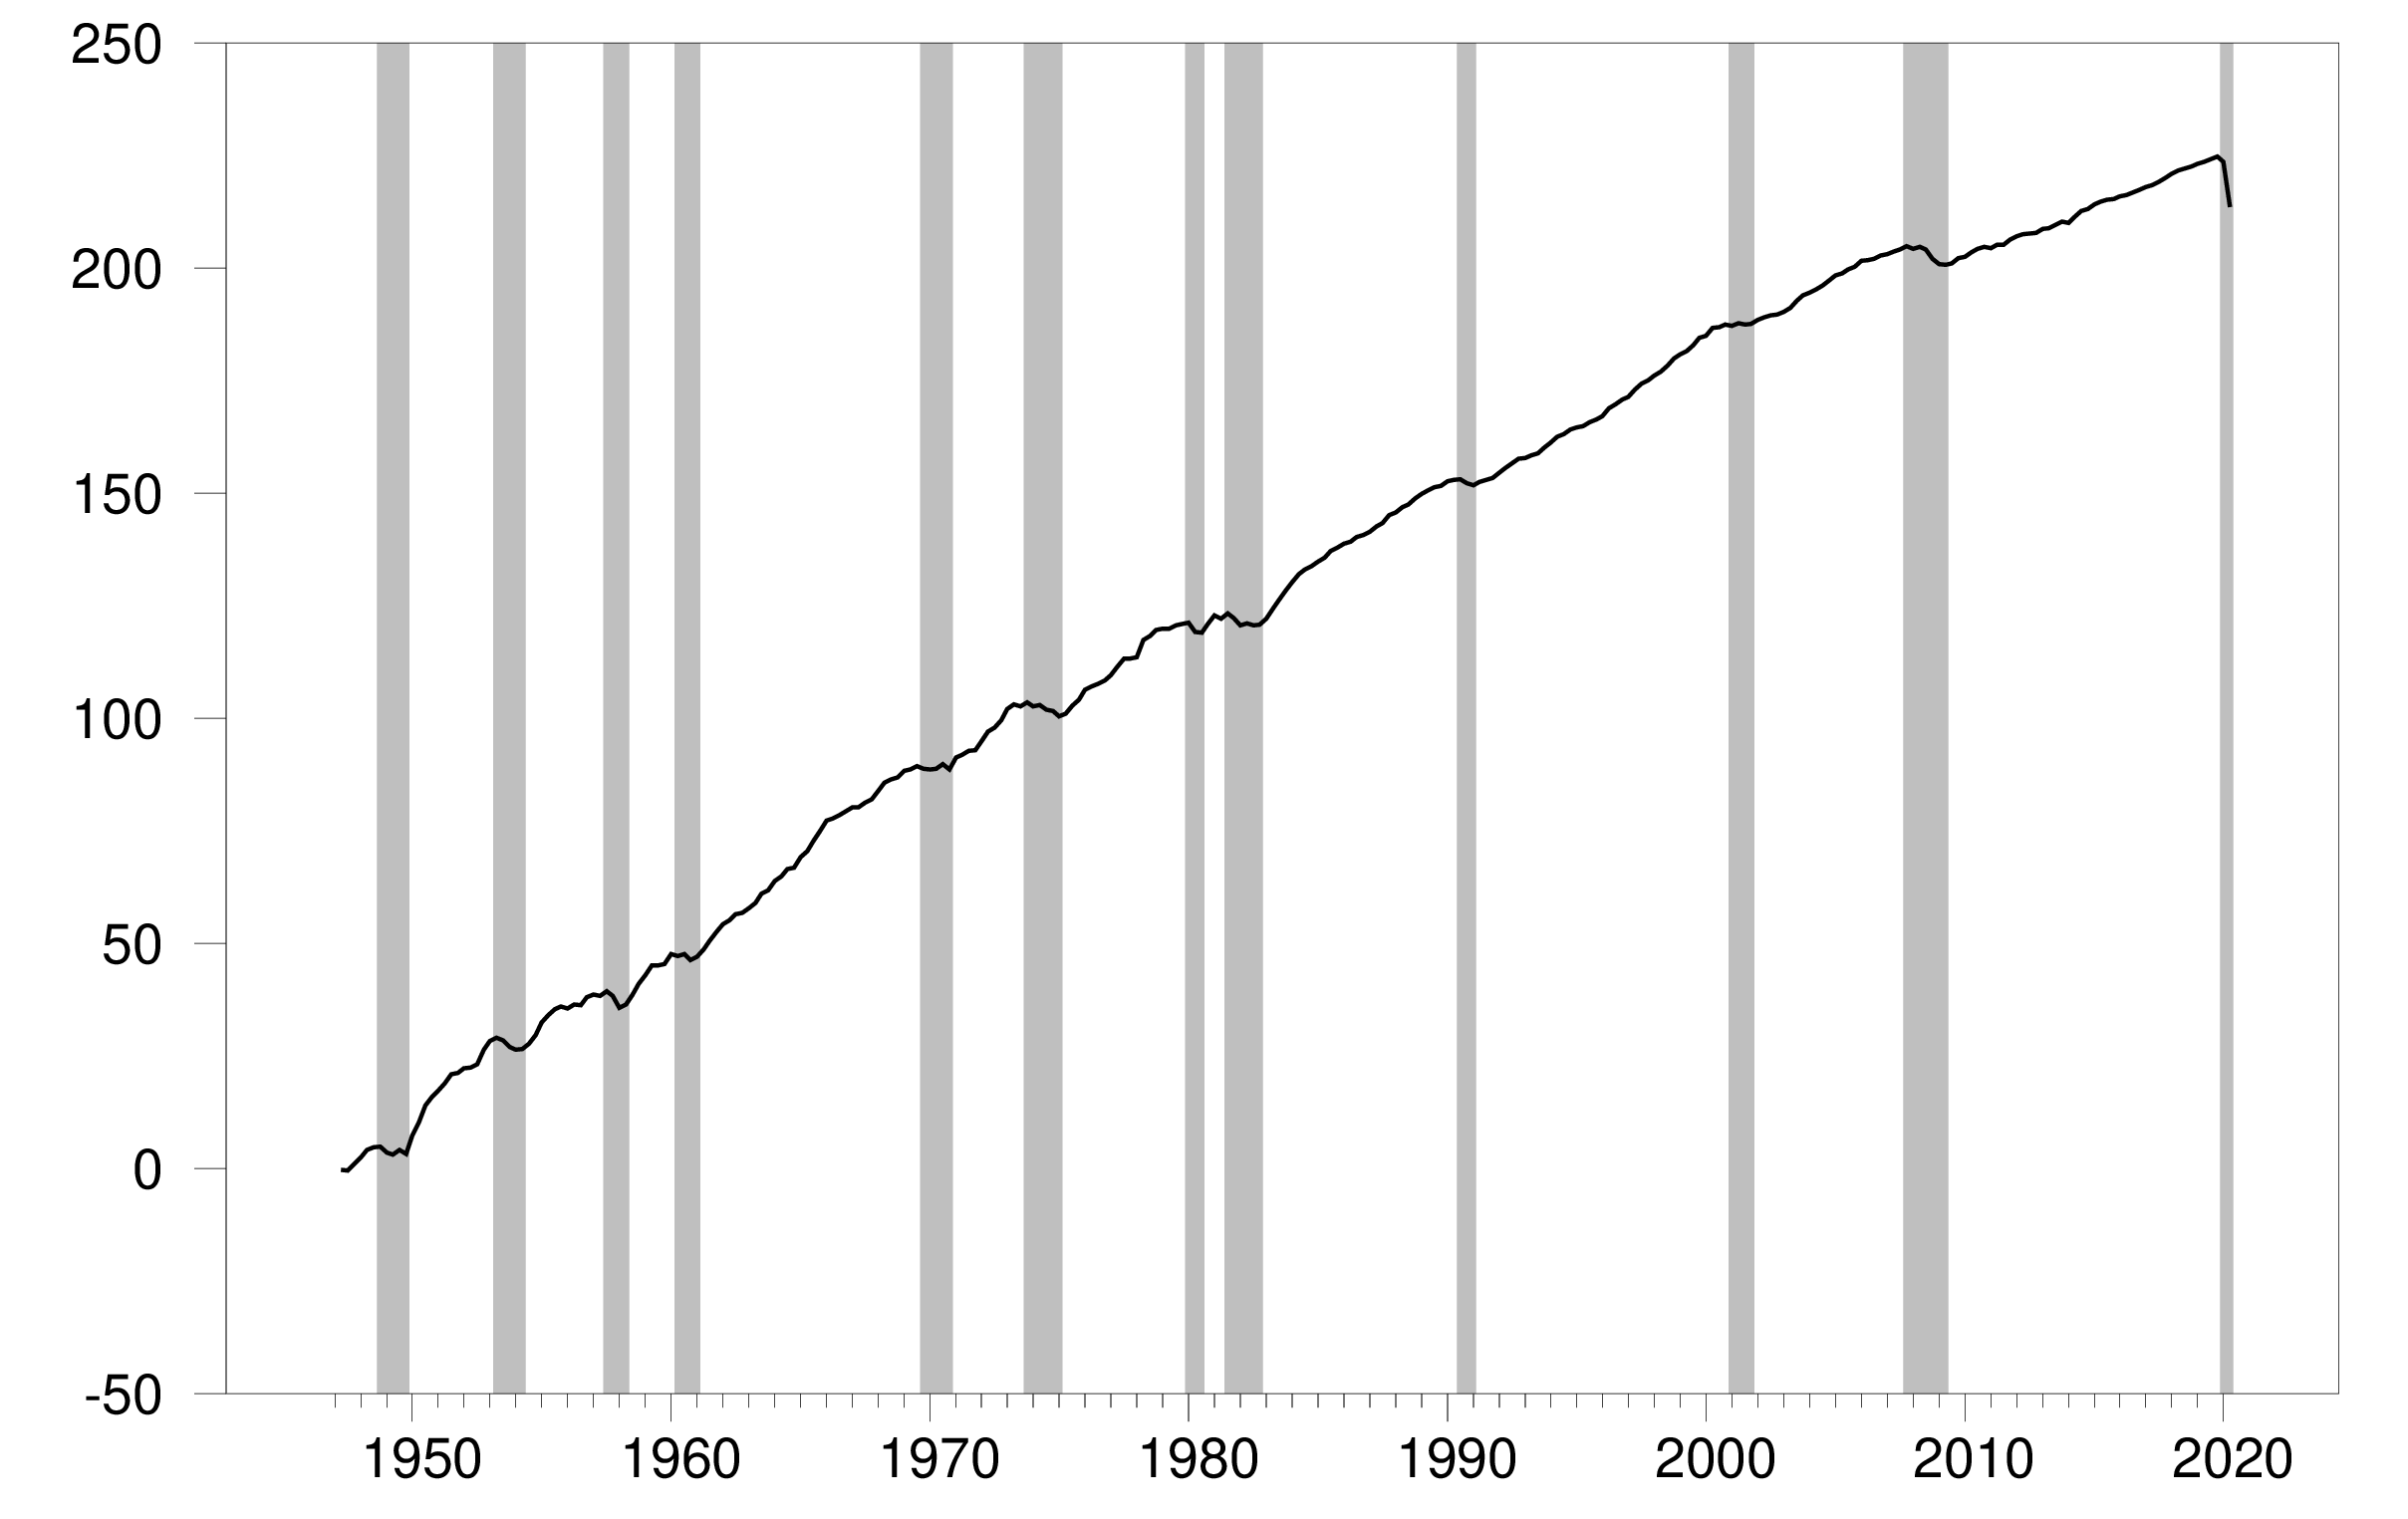
Cumulative change since 1947:Q1 in 100 times the natural logarithm of U.S. real GDP.
“(0.9054 – 1 = -0.329)” ????
[(0.9054 – 1)*4 = -0.329] maybe
Thanks pgl! Superscript 4 didn’t format correctly.
James is right to raise the change by the power of four rather than multiplying by four. By raising it by a power you cget the impact of compounding and that is especially important this time.
My formula is ((( q1/q2)^4)-1)*100
–
That should be the current quarter(q2) divided by the previous quarter(q1).
You and Dr. Hamilton are quite right. I quickly dashed off something and said “maybe”. I’m sure Dr. Hamilton’s initial draft had this right but moving into the blogger format caused a temporary slip. I too struggle with how to get WORD text into our Econospeak blogger speak.
Professor Hamilton,
A couple questions.
1. Should the annualized GDP be shown as 0.9051^4 -1 = 0.671 – 1 = -0.329 ?
(17,205.8/19,010.8)^4 = 0.9051^4 =0.671
0.671 – 1 = -.329
2. Even if the NY Fed uses a particular forecasting method, how can the NY Fed GDP Now be so different from the consensus forecasts?
AS:
1. You are correct. If this is the same question about formatting that pgl raised, it’s fixed now.
2. Different forecasters are using different models. Any private forecaster who really wants to get this right is going to pool a number of different models together, and modify their own estimates on the basis of what other people and other models are coming up with. The announced “consensus” numbers are actually a consensus (or average) of estimates that are each in some sense their own little consensus. The NY Fed is using one single model and framework, and I’d expect that’s almost always going to be beat by consensus-based methods.
If I can be allowed the extension of courtesy of going off topic by Professor Hamilton, I thought I would pass a long this news:
https://www.nytimes.com/2020/07/30/us/politics/herman-cain-dead.html?action=click&module=Top%20Stories&pgtype=Homepage
I would have considered voting for Herman Cain over Hillary, before the philandering stories broke. He struck me as pretty intelligent, and a pragmatist willing to find the middle ground (similar to say a Bill Clinton in his glory years). What struck me about Herman Cain, was although he was a “player” on AM band conservative radio, he was always exceptionally courteous and cordial to his phone-in callers, who often were of a lower education level than himself, but he was always respectful and kind. You don’t hear the other (I shall not name the laundry list) conservative talk hosts treat their phone-in callers who dare disagree (and even those who are sycophant like) with any kind of common courtesy. So this really struck me as I would sometimes listen to this AM radio carnival circus for entertainment while showering.
Herman Cain was at donald trump rallies in both Tulsa and Arizona—- without a mask. I could make some stronger comments here related to this. I will say I found Cain to be somewhat likable, and would have voted for the man (even though I am a Democrat) at one period of time.
If you are over the age of 65 or in a “high-risk” group immune system wise, let this be a lesson to you. Wearing a red MAGA hat without an accompanying surgical mask won’t give you immunity to severe respiratory viruses. Even if you have a Republican voting card. Strange……. I know…….
For those of us who are overseas what is the rate of growth at an annual rate that is this June quarter compared to the June quarter in 2019 please
Not Trampis The fall between 2019Q2 and 2020Q2 is 9.5% relative to 2019Q2.
2019Q2: $19,020.6T
2020Q2: $17,205.8T
The fall between 2020Q1 and 2020Q2 is:
2020Q1: $19,010.8T
2020Q2: $17,205.8T
That’s a drop of $1,805T, which is also a 9.5% drop relative to 2020Q1.
It’s a coincidence that this 9.5% number matches the 9.5% number for the year-over-year number.
But $17,205.8T / $19,010.8T = 0.905; i.e., GDP is only 90.5% what it was in the previous quarter.
(0.905^4) – 1 = -32.9% over the next year if we keep falling at the current rate.
I am with Slugs here. I don’t think annualized numbers are the correct approach. I think year over year is more representative, and that’s a decline of around 10%.
@Kopits
Did I miss something here?? I didn’t think 2slugbaits was taking sides on this issue. I thought it was pretty much neutral, and related to what question you were trying to answer, or looking for a reference point related to future, current, or past??
I mean, I’ll be honest and say I prefer SAAR, but as far as my argument with Rosser, it was mainly related to his taking shots at obvious SAAR tabulated numbers and then claiming using different metrics when his SAAR numbers were certain to be wrong. You don’t sucker punch professional economists’ SAAR numbers with drastically lower numbers and then go “Oh, but I wasn’t talking about SAAR”. That’s not how it’s done.
“time frame” is another way to say this I guess. What time frame are you analyzing?? For me I’m not that curious about Q1 vs Q2. If I’m asking about the broad effects of the virus, I’m wanting to look at before the virus hit. SAAR to me is answering as well as we can “How much pain is society feeling now because of the virus??” If I’m comparing immediate differences between quarters, I’m looking at “Is the pandemic worse than the health numbers are showing on paper??” or maybe “Have our earliest policy (post virus) decisions been smart decisions and/or how have we done implementing the policy decisions??” Immediate differences between the 1st quarter and 2nd Quarter aren’t going to give a good reference point on total societal pain (human cost/social cost/material loss) related to the virus/economic downturn.
Happy to be corrected here by someone who actually knows what the H they’re talking about (i.e. Menzie or Prof Hamilton)
Yes, Moses, on various occasions you have expressed your view that pretty much all economic variable numbers should be reported as SAAR, which I gather Not Trampis does not like, and clearly others here also do not like. For awhile you were insisting that in fact all such numbers are reported as SAAR, until Menzie pointed out that many are not.
I admitted that in my discussion of all this at times I was getting confused about which numbers were being reported as SAAR and which were reported on other bases, without wasting everybody’s time by going back to dredge through which were which. I shall note for the record after you demanded that I make a statement about an amount of decline that I would be surprised to see exceeded, I said -20 percent and made clear that was Q1 to Q2, not SAAR, which, of course, annoyed you. In any case, the quarterly decline was apparently -9.5% according to these initial estimates, so it did not exceed the limit I set.
I would suggest that you will be wasting everybody’s time if you try to turn this thread into some sort of denunciation of me about this or that error, Moses. I have agreed that I have made several along the way, most of the way, while also noting that I was the first here to point out certain data that did not fit stories being told. You questoned some of that data, but, again, I note that in at least one case Menzie had to correct you when you kept doing so. In any case, I think it is time to move on, although there is much here to analyze, and the most important takeaway i see is the importance of the decline in consumption of services as the major driving force of the outcome.
Not Trampis, 2slugbaits, Steven Kopits, & Moses Herzog:
i am going to strenuously disagree with using a year over year comparison to get an annual growth for GDP, because that method completely ignores what had happened in the intervening quarters…
for purposes of illustration, assume my entire economy is a single apple tree, and that it’s an everbearing variety that produces fruit at all times of year….i’ll now introduce two hypothetical scenarios on how my apple tree GDP might bear out…
example 1:
Y1, Q1 = 1; Y1, Q2 = 1; Y1, Q3 = 1; Y1, Q4 = 3;
Y2, Q1 = 3; Y2, Q2 = 5; Y2, Q3 = 5; Y2, Q4 = 5
example 2
Y1, Q1 = 1; Y1, Q2 = 3; Y1, Q3 = 3; Y1, Q4 = 3;
Y2, Q1 = 3; Y2, Q2 = 3; Y2, Q3 = 3; Y2, Q4 = 5
in both examples, Y equals the year number, Q equals the quarter number, and the numeric figure represents the number of apples my economy has produced in that quarter…as one can easily see, when using a year over year method the change in GDP is simply the difference between 3 and 5…using that method, you’d say my annual GDP examples are equal…however, if you add up the production for the entire year for both examples, example 1 shows that production has increased from 6 apples in year 1 to 18 in year 2, or that our GDP has tripled, but example 2 shows that our production has increased from 10 apples to 14, just a 40% rise…your year over year method would say growth was at 66.6% for both examples…
for purposes of illustration i have not computed quarterly growth at annual rates, anyone who wants to try that, have at it, be my guest…
rjs i am going to strenuously disagree with using a year over year comparison to get an annual growth for GDP
I don’t think I ever said anything about a year-over-year comparison. If you’ll reread what I said, I was referring to the current quarter to a previous quarter one year away. A year-over-year comparison is something that is an option at BEA. They simply take the sum of the quarterly GDP in levels and divide by 4 to get the annual GDP (not to be confused with the annualized GDP used in the SAAR calculation). I think you’re strenuously arguing against something that I never claimed.
I took objection to the notion of a 32.9% decline at an annual rate. If this were an ordinary recession, then these sorts of trends would be meaningful because they would provide insight into events to come.
In this case, however, we are talking principally of an outage. I think Atlanta has GDP rising by 20% annualized for Q3. But this is as meaningless at a 32.9% fall. GDP is not going to rise 20% in the coming year, just as it was not going to fall 33%. These numbers are true, but they do not provide much insight beyond being good cocktail party statistics. It’s like talking about a plane which has been plummeting by 10,000 / minute and saying at this pace it will hit the ground in three minutes. But the plane is actually rising rapidly, not falling. And then one could conclude that at this pace, the aircraft would reach the moon in some given period of time. The first proposition is already falsified and the second, unfounded.
A more meaningful question is, how much damage did the virus do in Q2. It knocked about 10% off of Q2 GDP yoy, and probably twice that in the worst weeks of the downturn. That’s a meaningful number which helps us to understand the impact of the virus on the economy. In outages, levels are a better indicator than trends, except for short, specific periods of time.
“ I took objection to the notion of a 32.9% decline at an annual rate. If this were an ordinary recession, then these sorts of trends would be meaningful because they would provide insight into events to come.”
Steven, the saar gives you an idea of what to expect if you ignore the problem and dont take proper action. It tells you a poor response will be problematic. Unfortunately half the nation ignored the warning, so we will have problems the remainder of the year. School reopenings will be a drag on the economy because we did not prepare for them properly.
The idea that there is a “correct” approach is nonsense. There are useful approaches (plural), misleading approaches and so forth, but no one correct approach. A y/y presentation of a single data point does not indicate what happened in the latest period, only what has happened over a year’s time. If a single period’s performance is in question, as is clearly the case when reporting a new quarter of GDP data, then y/y leaves out a good bit.
I suspect your are mistaken in claiming that 2Slugbaits is on your “side”. He certainly didn’t say so. Rather, he explained how to interpret an annualized % change.
macroduck, please see my objection to the year over year method above; thanks
Two things that haven’t gotten a lot of attention:
(1) Inventories have fallen in four of the last five quarters. And drops in 2020Q1 and 2020Q2 were pretty steep at -1.34 % and -3.98%. Even if the economy rebounds somewhat in the 3rd quarter suppliers are apt to be leery of any “bullwhip” effect.
(2) Personal saving as a percent of disposable income came in at a whopping 25.7%.
Beginning in 2010, food away from home has been over half of household spending on food – at least till now. It is very likely that some families are eating less now for budgetary reasons, but the bigger factor (as everyone here already knows) is seen in that 21% drop in food services and accommodation. The economy has been hit hard by the reduction in food eaten away from home in part because we have been eating some much food away from home – well above 50% of household food budgets in recent years.
The size of the drop in demand for food away from home is a quirk of the pandemic. In the Great Recession, there was also a shift in food spending from sit-down restaurant food to food prepared at home, but fast food consumption held up quite well. This time, fast food demand has fallen sharply, along with sit-down restaurant demand. Like the drop in carbon emissions, a decline in fast food consumption is a beneficial side-effect of the pandemic.
In the longer run, however, a further shift toward QSRs (quick-service restaurants, aka fast food joints), as people avoid sit-down restaurants, could lead to more obesity.
2slugbaits, not all of that increase in personal savings was “saved”…there has been a record drop in revolving credit outstanding…
see:
https://rjsigmund.files.wordpress.com/2020/07/july92020revolvingconsumercredit.jpg
consumers are simply using their stimulus checks to pay off old debts, which obviously would not have the economic stimulating impact the lawmakers who passed that stimulus had intended…
with a credit card apr of 25%, paying off debt is not a bad thing for the economy. in the long run, it provides consumers with even more spending power. and most likely, they will simply refill that credit card balance. carrying a credit card balance is a bit of a habit, not easily broken by a one time cash payment.
It was a drop of 9.5% I have just found out. Almost but not quite reaching the definition of a depression
Which shows a more accurate position of the economy the annual rate which every other nation uses or the annualised rate which is ONLY used in the USA
Not Trampis, it was a drop of 9.5% on top of the drop of 1.3% in the first quarter…so if your definition of a depression is -10%, it qualifies..
Not Trampis Comparing 2020Q2 with 2019Q2 is useful if your chief concern is whether or not you’re better off or worse off than you were last year at this time. In other words, it’s a retrospective comparison. And that’s fine. Sometimes that’s what you’re interested in. But the SAAR approach is answering a different question. Instead of comparing how we’ve been doing over the last year, the SAAR approach is forward looking and tells you where you’re heading if GDP keeps rising or falling at the current rate. So if I’m interested in knowing how much worse off the economy is today than it was a year ago, then I would want to compare 2020Q with 2019Q2. But if I want to project where the economy is headed (ceteris paribus) over the next year, then I should use the SAAR.
Nicely said. But I doubt Q3 will see anything close to the drop in Q2. In fact most people are saying income in Q3 will be higher than income in Q2. Not the 20% SAAR the village idiot Lawrence Kudlow is predicting. But even if Kudlow turns out to be right, that is a 5% increase after a 9.5% decline. Which of course Trump will call the greatest economy ever.
“Nicely said. But I doubt Q3 will see anything close to the drop in Q2.”
i agree 2slugs explained this nicely. and you are right, q3 will most likely not be like anything seen in q2. but the saar approach reinforces what you would see in q3 if nothing changes. we may not know what those changes are, but it gives us a baseline for comparison. there has been a nice discussion on this blog regarding the different measures of gdp. they all seem to serve a purpose, and i really don’t see how one is superior over any other. it all comes down to what information you are trying to extract, and over what time period. but i will agree, by having so many different ways to describe gdp, it is no wonder the public can be easily mislead by some of these numbers.
Right. The Q3 number will almost certainly be somewhat better than the Q2 number. That’s why my squishy ceteris paribus escape hatch.
I am pessimistic in the short run. The pandemic is nowhere near controlled, and Congress cannot get its act together to extend relief. There are still Republicans denying the obvious about how to approach the pandemic. And of course the kick-em-to-the-curb school of thought is very much in evidence in the Senate and administration. There will be less money available to people who will spend it right away. Bad things will follow.
That should be the current quarter(q2) divided by the previous quarter(q1).
apparently my previous comment was missed.
Here is my formula for calculating the quarter to quarter annualized growth rate.
=(((q2/q1)^4)-1)*100
that is the current quarter divided by the previous quarter. You raise it by a power rather than multiplying to incorporate the compounding effect and that is especially important this quarter.
“Personal saving as a percent of disposable income came in at a whopping 25.7%.”
Can anyone explain why Trump is planning to send out another round of checks (with his name on them) to a bunch of people who apparently have no immediate need for it and at the same time cutting unemployment benefits to those who do need it desperately.
I think the simple answer is that Trump sees the first category as middle class people that Trump regards as his base for the election and the latter as losers who wouldn’t vote for him anyway.
Trump is a psychopath.
I had the same thought. Writing those $1200 checks to people that really don’t need them will only make the deficit worse without stimulating much demand. And politically those higher deficits will encourage “deficit hawks” who have been in hiding for a while to come out of hiding after Biden becomes president. It will be Reinhart & Rogoff Redux. And it’s not like those who are stuffing their $1200 checks into savings will be the ones asked to pay for the coming austerity. No claw backs for them. The ones who pay for austerity will be the usual suspects.
joseph,
I guess that make Nancy Pelosi a “psychopath”: https://www.independent.co.uk/news/world/americas/us-politics/coronavirus-stimulus-cheque-nancy-pelosi-treasury-a9623221.html
You could not make it to the 3rd paragraph?
“Another round of the direct payments is “so essential,” Ms Pelosi told reporters on Thursday, saying it would help individual families struggling to make ends meet and kick-start the economy as a whole.”
She is concerned with a different group of families than the previous comments were referring to. But hey expecting the village idiot to piece this together is silly on my part. I hear you are struggling to learn how to tie your own shoes.
my first stimulus check went straight into a stock account. i have my doubts that we will qualify for another check, but if so, it will probably be more profitable. it would be better if the stimulus check was converted into unemployment insurance. the unemployed are the ones who really need it and will spend it. my check never made it into the real economy, so it had a very poor multiplier.
@ baffling
As far as the Federal Reserve is concerned, you couldn’t have spent it any better. Largely the Federal Reserve’s actions couldn’t indicate any stronger, that they don’t give a damn if it gets to MAIN street. And if dat huuuhts little Ben’s feelings, little Jerome’s feelings, or Sensitive Stevie’s feelings at Treasury, or any of the Fed Res’s very deferent academic friends that they occasionally throw small scraps of meat to, then well—- I’m “sorry, not sorry”.
baffling, we may not agree on much, but I agree with you on this point. The shotgun approach was not the greatest approach because too much of commerce was simply shut down by the state governors who expanded their authoritarian powers based on spreading the fear that “you’ll be the next to die if you don’t do exactly what I tell you to do.” People stopped traveling, stopped buying vehicles or new houses, stopped going out to eat or buying the non-essentials.
Some of us funneled the money to family members who needed it, so some of the money may have had one of its intended purposes met: helping those in need. But there are many who simply socked it away… those not poor, but not that well off, because they felt too much uncertainty…. or invested it because they were financially secure and saw investment opportunities in the stock market.
I said to many of my friends that the “free money” was going to have many unintended and negative consequences. You’ve hit upon the unintended consequences and the negative consequences will be felt when those trillions of “free money” have to be paid back to the piper in one form or another. Trump is going along with the second installment, not because he really believes it should be done, but because he knows that he’ll be painted as heartless if he doesn’t. Meanwhile, Pelosi et al. are trying to jam all sorts of additional spending for their because they felt too much uncertainty. players. The targeted approach you envision is really not in the works.
What I suspect will happen is that Biden will win, the press will declare that the worst of Covid-19 is over and we can all go back to our lives as they were, and there will be a surge of makeup spending which will be credited to Biden’s genius.
“Meanwhile, Pelosi et al. are trying to jam all sorts of additional spending for their because they felt too much uncertainty. players”. Got garbled and didn’t notice it before posting.
“Meanwhile, Pelosi et al. are trying to jam all sorts of additional spending for their players.”
Bruce Hall too much of commerce was simply shut down by the state governors who expanded their authoritarian powers based on spreading the fear
At the beginning of the pandemic the R-nought was thought to be at least 2.4. If you do the math, that means “herd immunity” would not be achieved until 60% of the population had become infected. That’s 198,600,000 Americans. The hospitals would have been overwhelmed. Mortality rates would have been through the roof. The only reason we didn’t see those kinds of horrific numbers is because some states had the good sense to clamp down on nonessential businesses. As a result those states were able to get the Rt numbers below 1.00, with some getting down to 0.80. I think that fear was well justified. The problem was not that states clamped down too hard; it’s that states relaxed restrictions too soon because too many voters lacked impulse control and couldn’t stay away from bars, restaurants and pool parties. Trump’s “LIBERATE MICHIGAN” tweets didn’t help. As to governors’ “authoritarian powers,” what about egocentric voters with a solipsistic worldview? What could be more authoritarian than some belligerent, asymptomatic MAGA hatter who refuses to wear a mask and infects an innocent person? Are states acting with “authoritarian powers” when they prohibit drunk driving? Do you feel your God given right to get hammered at the bars is somehow infringed upon? There is no meaningful difference between laws that limit the spread of coronavirus and laws that prohibit drunk driving. Both are legitimate tools against social menaces.
As to the economy, compare our pathetic response with what the EU countries did. They took a big hit early on but managed to get the virus under control. Yesterday Germany had 1,012 new cases and 3 deaths. Spain had 3,092 new cases and only 2 deaths. France had 1,346 new cases and 11 deaths. Italy, which was ravaged by the virus early on, only had 379 new cases and 9 deaths. Meanwhile, the US saw 70,904 new cases yesterday along with 1,462 deaths. Winning! Tiger Blood! The obvious lesson here is that if you take your lumps early and hard and you will be able to return to something like normality much sooner.
What I suspect will happen is that Biden will win, the press will declare that the worst of Covid-19 is over and we can all go back to our lives as they were, and there will be a surge of makeup spending which will be credited to Biden’s genius.
And it will be well deserved. If Trump had followed the same policies as the EU countries, then he would very likely be in a winning position. He has no one to blame but himself. But based on new Vanity Fair reporting we now know that Team Jared recommended a conscious strategy to make things a living hell in the blue states with the expectation that the virus could be contained to just those states and the Democrats would be hurt in the fall. The ancient Romans used to literally erase the names of horrible emperors from public buildings. I think we should do the same after Trump leaves. In the hall of portraits we should just leave an empty space between Obama and Biden. History books should include an asterisk noting the gap. A generation from now people who voted for Trump will misremember things and claim to have voted for Biden, just as Nixon voters came to misremember how they voted in 1972.
2slug, it is what it is. Michigan’s Gov. Whitmer closed Michigan’s economy and kept everyone safe. Oh, wait, well she did at least close the economy down. So did a lot of other governors who were more than happy to flex their political power like Cuomo in New York who forced infected people back into the nursing homes where as many people died in those as so far in the whole state of Florida. It must have worked. Whitmer is now the darling of the authoritarian left who brook no disobedience. Cuomo is lauded for his “leadership”.
And I agree with you, who could be more authoritarian than those maskless rioters who were crowding together for weeks and weeks? “You don’t have to agree with us. We’ll just destroy you and everything you have.” Right out of the books of Stalin, Mao, Pol Pot, Castro, Chavez, et al.
Bruce Hall Initially the rate of transmission in Michigan was 2.84 in late February. She got it under 0.80 for almost 6 weeks. It started to climb in late May when Trump came out with his “LIBERATE MICHIGAN” nonsense. Despite that, she has managed to keep it very close to 1.00 (currently at 1.01).
As to those threatening maskless rioters, I’m assuming you are referring to those gun-toting MAGA hat wearing jerks demanding their right to get drunk at bars.
“baffling, we may not agree on much, but I agree with you on this point.”
actually bruce, we do not agree. if we had agreement, you would be all for continued support for unemployment insurance. this money will go directly to people in need, and will be spent in the economy. i very much doubt you support this approach.
“I said to many of my friends that the “free money” was going to have many unintended and negative consequences. ”
money was necessary to support the economy. contrary to your belief, bruce, a shutdown was required. and before you bemoan the “trillions” spent, i want you to understand this was spend under a republican white house and republican senate. republicans spent that money-just not as wisely as they should have.
“What I suspect will happen is that Biden will win,”
yes biden will win. most of the nation understands what a mistake trump was. the coronavirus became the trump virus because he was incapable of leading the country through a crisis. the nation has had enough. even fellow republicans are anxious to rub the trump stink off. the question becomes, how much damage is trump and folks like bruce hall willing to do before leaving office.
The “Bruce Hall Speed Reading Method” involves reading a title, linking to the article, claiming it says what he wants it to say and hitting send. Reading to the 3rd paragraph just slows him down. How many times has Bruce linked to articles which either say nothing about what he claims they say, or contradict what he claims they say? Ummm…every time?
Which, by the way, is why I think Bruce is not necessarily weak-minded, but a paid troll. He is too consistently wrong about the meaning of sources he cites. The odds of misunderstanding every time seem to me outside the realm of the possible. A weak mind cannot account for being wrong every time.
What motive could Bruce have for spending so much time ruining his reputation? Money seems the most likely one. We know that right-wing money pays for the spread of misinformation and doubt. In that way, the right wing in U.S. politics is just like the Russian government. In other ways, too, apparently, but this one is clear. Econbrowser has gleaned enough praise to be dangerous to the right, which is reason enough to think money would be spent to tip the balance away from fact and analysis, toward doubt and lies.
Bruce didn’t read to the third paragraph because that isn’t what he’s paid to do. He’s paid to serve his masters, and they want a benighted world in which fact, reason and principle lose to right-wing interests, every time.
Precisely!
OK – how do you target families in dire need versus families not so much in dire need? Maybe that would be a good thing but our current political leaders do not exactly have their act together to have an ideal transfer payments system.
do not exactly have their act together to have an ideal transfer payments system.
Yes. As I’ve complained before, our reliance upon state unemployment agencies to handle a pandemic is not up to the job. As a result Congress had to put together a clunky Rube Goldberg contraption. It’s the American Way. The $1200 stimulus checks were essentially a bribe to get Senate GOP support for the enhanced unemployment insurance. Time was of the essence, so while I was not crazy about well-to-do folks getting those checks, it was a price worth paying for the necessary stuff in the rest of the packages. In the package currently under negotiation the Democrats are setting some income limits on who will get those checks. If I were king the legislation would include some kind of claw back provision for upper and upper middle income folks.
“a clunky Rube Goldberg contraption”
let me provide a concrete example of the problem with how the contraction was made. i was able to collect a stimulus check-not the full check, but a portion. my 2019 taxes would not permit this, as the agi would have been too large. but the taxes were delayed until july 15. if you did not file your 2019 taxes, treasury would use your 2018 agi to determine your qualifications. my 2018 agi permitted me to collect a check. thus by waiting until july 15 to file my taxes, i was able to collect a paycheck from uncle sam while i collecting interest on the amount i owed (interest rates are very low, so it is more of a semantic argument here). and that paycheck went directly into an sp500 index fund which increased quite a bit in value. and there is no clawback provision. thank you very much uncle sam. there were better ways the government could have deployed money, especially to those that were unemployed. trump taught me to think this way…
Bruce Hall: “I guess that make Nancy Pelosi a “psychopath.”
Bruce, you nitwit, the Democrats’ bill does not include a simultaneous cut in unemployment benefits. In fact it extends the current $600 Pandemic Unemployment Assistance until the end of January 2021.
You don’t have to speculate about this. Pelosi and the Democrats passed their HEROES Act bill way back in May. You can read the complete text on line. It is in the Congressional Record. The bill has been sitting on Trump and McConnell’s desks totally ignored for two and a half months. What have they been doing with their thumbs up their butts for the last couple of months while the economy goes down the drain? The Republicans are idiots incapable of doing their jobs.
Hey, Big Joe, Nancy’s “free money” proposals go way beyond unemployment benefits.
But I’ll give you a little anecdote about “unemployment benefits”. Our young neighbor who is a tradesman was laid off in March. He got his unemployment plus his “bonus” benefits. We were aware of an available job for the construction company that built our home so we told him about it. Several weeks later we asked him how the interview went and he said he decided that he wasn’t going to work for awhile.
Wonder why….
joseph,
You are correct. And the simple answer to your question is that you are considering different needs than is Trump. The ‘needs’ of recipients vs. the ‘need’ of Trump to get re-elected. Change your focus and it is rational. Sociopathic, but rational.
Hey, Wally. How about all of those politicians supporting the “mostly peaceful protests” that burn businesses, loot, and attack people? Sociopathic, but rational because they are playing to their base.
I live here in Seattle. What you see on the right wing news is not exactly what is going on. Most of the protests are indeed peaceful. There are a handful of agitators who stir up trouble. And then the little green men move in and all he’ll breaks loose. But it is isolated. It is a local problem that can be handled locally. The local mayors and governors should be the ones handling the response. Not a cornered rat in the White House bent on sound bytes. Let the locals stand or fall on their own and only send in well trained and equipped federal forces if called upon. And never send illtrained little green men. Your bunker bky thinks he is Putin.
for anyone interested in the revisions, here’s what i have….economic growth over the period from 2014 to 2019 was at a 2.3% annual rate, the same net growth over the period that was previously published….however, that was as the 5 year annual growth rate of personal consumption was revised down from 2.8% to 2.7%, the 5 year annual growth rate of private investment was revised up from 2.2% to 2.5%, the annual growth rate of exports was revised from 1.1% to 1.3%, the annual growth rate of imports was revised from 2.6% to 2.5%, and the growth of government investment and consumption was revised to a 1.9% rate from the 1.8% rate that had been indicated by the GDP reports prior to this revision…
This report also showed that the GDP growth rate for 2015 was revised from the previously reported 2.9% to 3.1%; that the growth rate for 2016 was revised from the previously reported 1.6% to 1,7%, that the GDP growth rate for 2017 was revised from the previously reported 2.4% to 2.3%, that the growth rate of 2018 was revised from the previously reported 2.9% to 3.0%, and that the growth rate for 2019 was revised from the previously reported 2.3% to 2.2%…in addition, there was considerable revision to the growth rates on a quarter to quarter basis; for instance, for 2019, the growth rate of the 1st quarter was revised from the previously reported 3.1% rate to a 2.9% rate, the growth rate of the 2nd quarter was revised from the previously reported 2.0% rate to a 1.5% rate, the growth rate of the 3rd quarter was revised from the previously reported 2.1% rate to a 2.6% rate, and the growth rate of the 4th quarter of 2019 was revised from the previously reported 2.1% rate to a 2.4% rate…
The growth rate of first quarter of 2020, which had been reported at minus 5.0% when we reviewed it a month ago, remained at the same rate as previously published, as downward revisions to personal consumption, net exports, and private inventory investment were offset by upward revisions to fixed private investment and federal government spending state and local government spending…the first quarter change in personal consumption was revised from minus 6.8% to minus 6.9%, the first quarter change in gross private investment was revised from minus 10.2% to minus 9.0%, the first quarter change in exports was revised from a minus 9.0% rate to a minus 9.5% rate, the first quarter change in imports was revised from a minus 15.7% rate to a minus 15.0% rate, the first quarter growth rate of the federal government was revised to +1.6% from +1.1%, and the growth rate of state and local governments was revised from +0.5% to +1.1%….the first quarter contraction rate of current dollar spending was revised from a 3.47% rate to a 3.38% rate, while the GDP deflator for the first quarter was revised from +1.3% to +1.4%…
“What I have done to keep the index going is to fix parameters at the values estimated as of 2020:Q1 and interpret the 2020:Q2 data from the perspective of the historically observed patterns.”
With all due respect, that’s about as good a real time definition of a discontinuity and I’ve ever read.
joseph,
Yep, a check to the employed and unemployed alike, while trying like crazy to end the federal supplement to unemployment insurance payments, which go to people who actually need, and spend, the money. Policy, for Trump and today’s Republican party, has nothing to do with good economic management.
Reagan’s tax cut experiment failed. Privatization of government services mostly failed. Deregulation with a meat-axe failed. Obamacare worked. Ignoring the pandemic failed. The main elements of the Republican economic agenda amount to doing more of what has failed and destroying what has worked.
Guess I shall put this as a fresh comment not tied to any others. Something that needs to be kept in mind and has been a topic of much discussion here, although momentarily forgotten about with this report coming out, is that in fact it looks like the US economy has been growing for about three months now, basically since about the end of April. And it initially bounced up fast enough to look more like a V than any other letter or symbol, with that rate declining since, with there being a possibility it could actually cease and we might get some kind of weird looking W with a fresh round of decline.
Of course all of this is based on monthly data, and as we are being reminded, official GDP estimates are quarterly. That means that in this period with more massive short run changes, both down and up, than we have ever seen basically, the quarterly numbers are really not all that useful, even possibly misleading. My biggest mistake back when I first began noting here that reports on things like monthly retail sales and labor employment were coming out better than what was being forecast, and I threw out the idea that Q2 might see positive growth over Q1 was that I inaccurately had it in mind that what was beinjg measured was end-of-quarter numbers. So strongly positive growth in May and June might have offset the sharp decline in April. Menzie quickly corrected me, which I accepted.
What we are looking at are in effect averaged over whole quarters. So more than two third of the first quarter, well into March, had high GDP numbers reflectin the situation before the economy “fell off a cliff.” We basically had this very sharp plunge that wnet from mid-March to the end-of-April, after which the economy bounced, although it is indeed the case that there is wide variation across the economy how sectors are doing, with these conttrasts much sharper than usual. So, even though a majority of Q2 was a period of positive gtowth, with some of it quite rapid, especially in some parts, the average level of the quarter has been way below the average level of the Q1, agood 5/6 of which was basically before the GDP fell. Indeed, I do not know, but my initial intuition that GDP at the nd of June might be higher than it was at the end of June, well, I do not know if we shall ever know how they compare. But while it is completely reasonable that the average GDP of Q2 was -95% lower than average GDP of Q1, there is no way GDP at end of Jhne (and certainly not now) was -9,5% lower than GDP ate end of March. But, we may never know the answer to that, and there certainly will not be an official answer as the official numbers are all quarterly.
In any case, the economy is clearly slowing down again, with a possibility of even going into negative growth. I am making no forecast about Q3 as this obviously depends on what happens with the pandemic, which I am making no forecasta about. But I do doubt that Kudlow will get his 20% growth, with that I guess an SAAR number.
“What we are looking at are in effect averaged over whole quarters.”
it may be better to think of gdp numbers as the integral of the economy over a specified time? averaging things runs into weighting issues? comparing results by thinking of it as the area under the curve might prove more useful?
Basically yes, baffling, at least according to my current understanding, although if either Jim H. or Menzie C. says I am wrong, I shall say, “yes sir.”
This makes sense to me. Never mind the occasional typo. And it is a perfect example of why the reporting period and data set that contributes to the report is important. As long as we know how the numbers were calculated and what they mean, the specific reporting period is not so important. It is an analogue thing, not yes/no.
This argument over quarterly rate vs annualized rate is nonsensical.
Policeman: You were doing 60 in a 40 zone.
You: That’s an outrageous exaggeration. I was only doing 1 mile per minute.
Policeman: Okay, wise guy, step out of the car.
The reason for using an annualized rate is that you are interested in you instantaneous speed using a common denominator. You don’t want to be converting back and forth between miles per hour and miles per minute. Likewise you always use annualized rate not quarterly rate.
I think part of the problem is that many people incorrectly think of GDP as a stock instead of a flow. They want to know how much the stock of GDP went down this quarter. If you keep in mind that GDP is a flow, you know that it is a rate with a denominator of time. And to avoid confusion you always use the same units for the denominator, an annualized year.
Well folks, it looks like the “nimble mind” of Joe Biden, when he’s not flirting with choosing a VP who might as well have called him the George Wallace of northeastern racial segregationists, has found himself another “winner” in the VP running competition:
https://twitter.com/AlxThomp/status/1289325268918661122
If you can’t watch all of the under 2-minute video, Karen Bass says she thinks Scientologists are wonderful people doing wonderful work. I’m sure Republicans won’t use this in the campaign. I’m just gonna say this, if Biden’s campaign staff chooses Karen Bass to be on the ticket, Democrats needn’t make any other moves for the next 100 years to prove beyond all doubt, that the DNC are political masochists.
I just heard Susan Rice describing her father Dr. Emmet J. Rice who served with the Tuskegee Airmen before he got his Ph.D. in economics from UC Berkeley. He went on to teach economics and to serve on the Federal Reserve Board among other positions. An accomplished man with a very accomplished daughter.
Both Rice and Harris have accomplished fathers. Harris’s is a retired economics prof at Stanford and has served as an adviser to the UN. I took several courses from him when he was at the University of Wisconsin-Madison and know him quite well. Unfortunately he and Kamala do not have very good relations, with this apparently mostly due to holdover sentiments from the ugly divorce between her parents, with her having sided with her mother reportedly.
Anyone who runs for President or Vice President is by definition ambitious. But if a capable black woman wants to serve our nation in this capacity
https://www.independent.co.uk/voices/kamala-harris-biden-vp-notes-democratic-debate-vice-president-a9646126.html
Kamala Harris isn’t ‘too ambitious’ to be Biden’s VP. We know what the real problem is
Former Senator Chris Dodd, a member of Biden’s vice presidential search committee, was reportedly concerned about Harris after she refused to apologise for embarrassing Biden on the first Democratic debate stage, righteously taking him to task for working with segregationists and landing on the wrong side of history on the issue of school bussing. “She laughed and said, ‘That’s politics.’ She had no remorse,” Dodd allegedly said, as reported by Politico. And now a number of Biden’s supporters and most influential donors are reportedly working to stop Harris from becoming vice president, too, arguing that she is “too ambitious” and “will be solely focused on becoming president herself”.
I generally like Senator Dodd but has he lost his eff’ing mind? What does he want – a sycophant like Mike Pence? Spare me.
Biden ha made clear he wants somebody like Biden. Loyal, useful, capable and likely to bond in friendship to the president. His “transitional” assertion is ambiguous enough to allow pople to read into it what they want. “I’m making a path for progressives.” “I’m old, but the next one will be young.”
My favorite is “If Barack had handed off to me, Trump would never hve been elected and the country would not have been through this horror. I’m going to lay the transition to another Democratic president so this doesn’t happen again.” Not sure he can pull it off, but we can’t afford any more Republican presidents like the last two.
The reality is Joe Biden backed out for his own personal reasons—Joe Biden backed out because Joe Biden didn’t want to run/lose. He rightly foresaw that Hillary Clinton would peel off at least 50% of his female votes. He never would have won the nomination with Hillary in the race. And even if one wants to make the ridiculous assertion he could have won the race, it would have made for a mell of a a hess of a DNC convention.
This Biden bullcr** of “It was because President Obama stayed neutral, and let the children fight it out among themselves, is why I didn’t run in the 2016 race” is pure unadulterated bullcr** and Biden knows it’s bullcr**
The true question. is, do we really mean “ambitious” when we describe Kamala Harris, or do we mean a woman who is willing to enact policies that hurt blacks and hurt poor people, to get where she wants to go?? If she steps onto the heads and shoulders of low-income and vulnerable people, to get where she wants to go, including sending her own race into prisons forever for minor crimes, and refusing to hear/see evidence that clears African American men of crimes, what is she not willing to do??
https://www.youtube.com/watch?v=Uk2OLz–V3c
https://theintercept.com/2019/02/07/kamala-harris-san-francisco-district-attorney-crime/
https://theintercept.com/2019/06/09/kamala-harris-san-francisco-catholic-church-child-abuse/
https://theintercept.com/2019/03/13/kamala-harris-mortage-crisis/
https://theintercept.com/2017/01/05/kamala-harris-fails-to-explain-why-she-didnt-prosecute-steven-mnuchins-bank/
https://sanfrancisco.cbslocal.com/2019/08/01/analysis-tulsi-gabbard-kamala-harris/
Let’s also remember, Kamala Harris blocked evidence from being heard which could have possibly freed innocent inmates (most of them Black) and during an interview laughed about using marijuana, a crime Harris sent thousands of Black Americans to prison for. I guess she has the similar attitude as suburban whites. When she smokes marijuana, it’s “cool”, when low-income Blacks and hispanics smoke marijuana they are a detriment and a drag on society.
I have had other comments filtered here, because of mentioning her relationship with Willie Brown. It’s no secret in San Francisco/Oakland she had a carnal relationship with Willie Brown. I say if these topics are discussable with Bill Clinton, then they are also discussable with Kamala Harris. Harris got funding for her campaign runs in California because of that relationship.
Oh, what a waste of time bothering to comment on this, but, Moses, if you are going to link to something drawing on Tulsi Gabbard after denouncing her, well…. So I looked at that link. It discussed five issues she criticized Harris on. It came down that on two of them Gabbard was raising serious questions and Harris does not look good on them. On two of them it said that basically Gabbard was full of it and just spouting misleaing fake news propaganda. And on the fifth one it is a complicated matter and hard to tell.
So, wow, big deal. We know Harris made some decisions in the past that do not look good now, with her having repudiated some of them. She has baggage as do all of the serious VP candidates. Heck, your Susan Rice also has serious baggage, probably worse than Harris’s, so sorry. Look at WaPo column today by Dana Milbank. He says that if Biden picks Rice for VP, it will be a “costly mistake.” We can start with her covering up for a genocidal Rwandan dictator who was her privare client, oooph! There is a lot more, including how when she was put up for SecState both Dems and GOPs were against her for a lot of reasons, with a lot of her problems tied to never having run for office for anything. He says she is very capable and should have an important position in the Biden admin, but not VP, no way. Sorry, Mose.
https://www.nbcnews.com/politics/meet-the-press/nation-s-testing-czar-it-s-time-move-talk-about-n1235600
Dr. Brett Giroir, who coordinates the Trump administration’s coronavirus testing response, said Sunday that there is no evidence that hydroxychloroquine is an “effective” treatment for COVID-19, despite President Donald Trump’s repeated boosting of the drug over objections from experts … “Most physicians and prescribers are evidence-based, and they’re not influenced by whatever is on Twitter or anything else. And the evidence just does not show hydroxychloroquine is effective right now,” he said …”At this point in time, there has been five randomized controlled, placebo-controlled trials that do not show any benefit to hydroxychloroquine. So, at this point in time, we don’t recommend that as a treatment.”
We have had to endure Bruce Hall’s parade of disinformation where he claims over and over that hydroxychloroquine is a proven treatment. We have had to endure one crack pot after another that Brucie boy claims is true expert. When Giroir and other credible doctors say otherwise, we do not have to take their word for it. Five randomized controlled, placebo-controlled trials with all of them rejecting the junk science that Bruce Hall and other lying scum promote. One would think even the most desperate snake oil sales person would have given up by now.
Back to the economy. I see that construction spending is slowing in a far more normal manner than the hard stop in April.
that June construction spending report came in stronger than the BEA had estimated it would…for anyone who’s interested:
Construction spending for all three months of the 2nd quarter was higher than what was reported by the BEA in the advance report for 2nd quarter GDP last week…the annual rate of construction spending for April was revised $1.8 billion higher, and annualized construction spending for May was revised $8.3 billion higher…in reporting 2nd quarter GDP, the Excel file with key source data and assumptions accompanying the report indicated on line 84 that they had estimated that the value of June nonresidential construction would be $9.8 billion smaller than that of the previously reported May figure, that June residential construction on lines 110 and 111 would be $5.6 billion smaller than that of the previously reported May figure, and that the value of June public construction shown on line 200 would be $2.5 billion smaller than the previously published May figure…hence, the total of the figures used by the BEA for total June construction in the 2nd quarter GDP report were $17.9 billion less than the previously published May figure…with June construction now reported down $9.5 billion from a May figure that was revised $8.3 billion higher, that means that the BEA had underestimated annualized June construction spending by $16.7 billion when reporting 2nd quarter GDP…thus, after averaging the revisions to construction spending for the three months of the 2nd quarter, the total revised annualized figure for 2nd quarter construction spending would thus be $8.9 billion more than the figures used by the BEA when computing 2nd quarter GDP, implying they’d need an upward revision of roughly 0.21 percentage points to 2nd quarter GDP when the 2nd estimate is released on the 27th of August…
(source: the BEA and author’s calculations)
to get to the excel file that i used for the BEA’s source data, you need to access it from the BEA GDP site: https://www.bea.gov/data/gdp/gross-domestic-product
there will be another revision to GDP with the June factory inventory report tomorrow, and another one with the June trade deficit release on wednesday, so you can also compare that BEA file to the new data to see what the other revisions will be…
on today’s June factory inventories report: The BEA’s key source data and assumptions (xls) (see link above) for the advance estimate of second quarter GDP indicates on line 143 that they had estimated that the value of non-durable goods inventories would rise $3.8 billion before any inflation adjustment in June, and this report indicates that total non-durable goods inventories actually did increase in value by $3.8 billion, which means there should be no 2nd quarter GDP revision on account of June’s non-durable factory inventories…however, durable goods inventories, which had been used as source data for the advance estimate of GDP, were revised from the previously published $0.4 billion or 0.1% increase to $425.3 billion to a ‘virtually unchanged’ $0.2 billion increase to $425.0 billion with this report… that would indicate that they overestimated the change in the 2nd quarter GDP inventory component by more than $2.4 billion on an annualized basis, which would suggest that 2nd quarter GDP would have to be revised downwards by about 0.04 percentage points to account for what this report shows…
(sources: Census Bureau, BEA and author’s calculations)
https://www.cnbc.com/2020/08/03/president-trump-might-be-easier-if-microsoft-buys-all-of-tiktok.html
so trump now plays mafia boss and demands his cut from microsoft for allowing TikTok to be forced into a sale. all because the TikTok teens embarrassed the trump machine with the “million” tulsa rally attendees that amounted to about 600 folks. what an embarrassment trump is. this type of business climate will drive innovation away from the united states.
Dear James,
following your graphic log/log display of US oil consumption and gdp in your seminal 2009 paper (HAMILTON J. (2009) – Causes and Consequences of the Oil Shock of 2007–08 – Brookings Papers on Economic Activity, Spring 2009), I first published a similar graphic for COVID-19 in april for the world (Lepetit M. (2020 d.) – IMF & IEA GDP & OIL 2020 forecasts : Business As UnUsual – 19/04/2020 (https://www.linkedin.com/pulse/imf-iea-gdp-oil-2020-forecasts-business-unusual-michel-lepetit/) ; with – 3% for world GDP (IMF) and – 9% for world oil (IEA)) in 2020.
I have updated the figure in an article on NGFS (the network of Central Banks) energy transition scenarios (Lepetit M. (2020g) – Climate Transition Scenarios : 2020 Central Banks (NGFS with IPCC WG III IAMC) & 1990 Historical IPCC First Assessment Report (https://www.linkedin.com/pulse/climate-transition-scenarios-2020-central-banks-ngfs-ipcc-lepetit/?trackingId=uJSUg6VySGWnYubhG1fQ2g%3D%3D) : with – 5,2% for world GDP (World Bank) and -8% for oil (IEA)).
I would not be surprised to see the figure for 2020 world GDP getting even lower (-8% ?). And world crude oil consumption higher ? (-7% ?)
Très cordialement,
Michel