IMF research economist
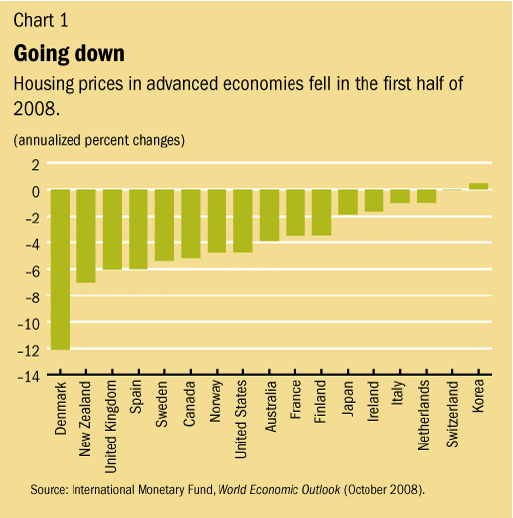
Prakash Loungani reports some statistics on the extent to which housing price declines are being seen worldwide.

|
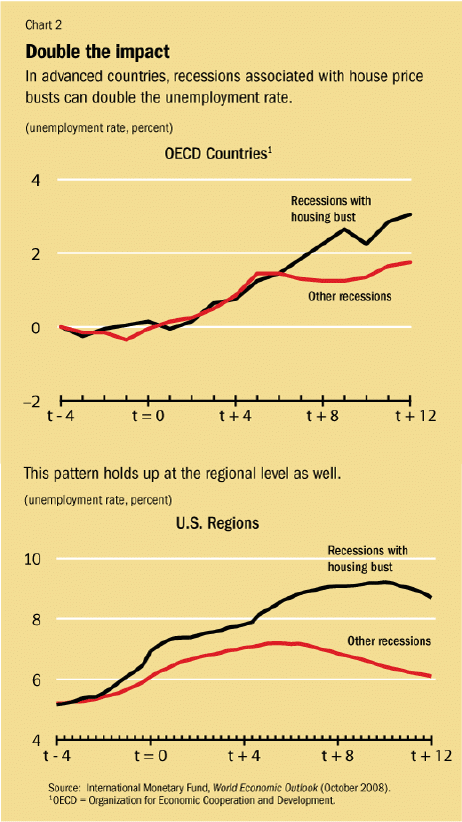
The house price decline during 2008 has actually been more modest in the U.S. than in countries such as Denmark, New Zealand, the U.K., and Spain, though the price decline has been going on for much longer in the U.S. and it is the cumulative decline from the price peak that is the key determinant of the extent of mortgage defaults. Loungani notes from previous international and U.S. regional experience that the bigger the real estate price decline, the more severe the economic downturn we might expect.

|
The Wall Street Journal also has some neat interactive graphics on international movements in stock prices and exchange rates.
Technorati Tags: macroeconomics,
housing,
credit crunch
Denmark? Last week George Soros had an Op-ed in the WSJ saying that the Danish mortgage system was much better than ours.
Interesting. Ultimately, the commodity-levered economies may experience more severe recessions thanks to record-high commodity prices that coincided with the housing bubbles and that are in the process of correcting more sharply than housing prices.
Be curious to see those charts extended out to t + 18, t + 24, t + 36.
Its interesting that Canadian house prices have declined more than the USA even though there has been much media information documenting the resistance that Canada has put up against this global financial collapse.
Its also surprising that Ireland’s housing prices have encountered such a significantly smaller decline than the UK.
bert: Canada enjoyed the commodities boom… that’s why it seems more resilient.
Ireland and Spain are swimming through very troubled waters… the residential sector there is doing really bad!
I find it interesting that the most socialist countries have the greatest problems and the most free market seem to have the least. Duh!
Once again we can surmise that government involvement with the real estate sector alters the free market and pricing dislocations lead to economic problems.
Contrary to what seems to be the common understanding we should feel encouraged as housing prices fall. There is little doubt that housing was in a bubble. If that is the case the best way to deflate the bubble is to deflate the bubble.
But right now the world is taking the position that they need to keep forcing air into the bubble to keep it inflated. They are dealing with whitewashing the symptom rather than allowing the market to return to normal are resolving the problem.
Last night I was watching the News Hour on PBS and it seemed I was in a time warp hearing the headlines from 1933.
JEFFREY BROWN: Though the plan is voluntary, Paulson reportedly made it clear in meetings yesterday with the heads of large banking institutions that their participation was virtually required.
This statement by the host Jeffery Brown was right out of the Hoover play book. When he called business leaders to the White House after the crash of ’29 his direction was “voluntary” but they were all required to participate. Bush like Hoover is attempting to continue wearing the clothing of free markets but it is nothing but a facade.
Then this statement from Richard Sylla of New York University.
JEFFREY BROWN: And are there precedents that you look to that help us guide our way?
RICHARD SYLLA: Well, we did the same thing back in the 1930s. And from 1933 to 1935, President Roosevelt authorized the Reconstruction Finance Corporation to inject capital in the form of preferred stock into banks.
There is simply no doubt. Both those for and against the bailout see it as a repeat of the Great Depression.
When tax cuts are proposed the first question is always, “How are we going to pay for them?” It is a senseless question because nearly everyone who has studied tax cuts know that they do in fact increase tax revenue it actually an argument over magnitude.
But now we have a massive increase in bailout spending and the same question is silent. Who will ask, “How are we going to pay for this?” And this question is much, much more important when you are talking direct spending.
Just another example of when politics is poison.
I find Loungani’s report incomplete in several respects:
In both cases, I believe that the data selected for charting was based more on soft-peddling the current crisis, than in clearly communicating its likely ramifications.
bert,Ikejiriohashi,
Housing prices started to drop much later in Canada than in the US, so looking at just the 2008 price drops is misleading. Outside Alberta, where there was a commodity boom-induced real estate bubble, and perhaps British Columbia, Canada didn’t have a big bubble.
They don’t have mortgage interest tax deduction, nor the exotic mortgage products. So their housing price drops are just part of a normal economic cycle.
Fat Man:
Resiliency of the mortgage system and the effect of housing price decreases are two different things.
Here in Canada, our mortgage system is much sounder than down south (partially thanks to a nifty feature of compulsory mortgage insurance if one’s downpayment is less than 20% — protects the lender, not the owner, and which is self funded through premiums paid by the buyer).
However, we have had our own irrational exuberance on the housing front, which started to correct late this spring — it is early innings here. Prices simply got too high in many cities — exceeding rent for equivalent accomodation, pushing affordability into the red zone, leaving ownership at an all time high. These markets will continue to correct. Hopefully it will not have the same disastrous effect on financial markets as the crash in the states, but it will undoubtedly have other negative effects on consumption etc.
I thought I’d respond to at least a few of the very good points raised by readers. The countries that I selected were simply those that were in a data set the OECD provided to me. There was no conspiracy to show countries selectively to prove a point. The OECD seasonally adjusts the data and this may account for why these data could look somewhat different from the headline numbers with which readers may be familiar. A couple of readers asked how the chart on the unemployment impact would look if it is extended beyond 12 quarters. I have that information for the U.S. regions (the bottom panel of Chart 2). After 24 quarters, the unemployment rate in the “other recessions” case has returned to its baseline of 5 percent. But the unemployment rate for “recessions with housing busts” is still quite a bit higher, a notch over 6 percent. Many readers have made interesting conjectures about why the cross-country impacts of house price corrections differ. My own, preliminry, evidence on this is contained in the IMF’s World Economic Outlook (see Box 1.2 in that document; available from http://www.imf.org)
The difference in the sources of house price data is also material here. The Case-Shiller home indicies show declines around 10% in the U.S. from December to June ’08.