If you focus too much on the latest statistics and speculation about what could go wrong, it’s easy to lose sight of some very important long-term trends. The solid growth of U.S. productivity is one piece of very good news that’s not getting sufficient attention.
There will always be some pessimists who think that productivity growth is a bad thing, reasoning that if one person can do the work of two, the unnecessary second worker will become unemployed. The record of history on that hypothesis is extremely clear, however. U.S. workers today produce more than three times as much per hour compared with their counterparts 50 years ago, and even so, the unemployment rate today is the same as it was in 1950. Instead of putting people out of work, what productivity growth has always meant in practice is a rising standard of living for everyone. No other statistic may be as important for determining long-run economic welfare as productivity.
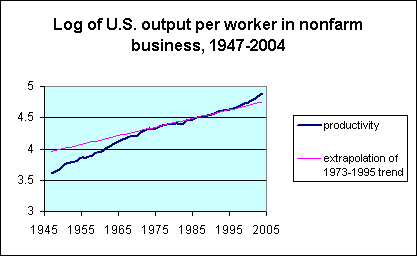
Between 1947 and 1973, U.S. output per worker chugged along impressively at an annual growth rate of 2.7% per year. Beginning in 1973, however, that trend abruptly deteriorated, with productivity growing at only a 1.4% annual rate for the next two decades.
The consensus among most economists is that there is no one factor that accounts for that productivity slowdown, but rather that it was the result of a series of different influences that each made a modest contribution and happened to occur at about the same time. Among the factors that are likely to have played some role are increased safety and environmental regulation, reduced investment in productive equipment, and demographic changes,
along with a number of other developments.
Just when economists were thinking we understood that trend, however, the facts on the ground were reversed. U.S. productivity began to grow quickly again in the late 1990’s, and there now are enough data to suggest that this change is for real. Between 1995 and 2004, U.S. output per worker grew at a 2.9% annual rate, even faster than the impressive pre-1973 pace. It’s hard to attribute this to a change in any of those factors thought to have contributed to the slowdown in the seventies. Instead, the good news seems to be the result of a new set of favorable developments, chief among which is the way that computers and information technology have changed so much about the American workplace.
Whatever the explanation for the productivity gains of the last decade, the above graph displays every indication that this welcome development is continuing. Most recently, the Bureau of Labor Statistics reported productivity gains at a 3.2% annual rate for the first quarter and 2.2% annual rate for the second quarter of 2005.
So why doesn’t that get more attention in the press? I guess the headline, “decade of good news continues” just doesn’t sell as many papers.
Dr. Hamilton:
Sorry about that last post, being somewhat of a newbie, I’m admittedly not entirely aware of the type of standards you employ for this blog.
In response to this post: what about marginal returns? And are you planning on answering some of the questions posed in your “Limitations of the Hirsch report on peak oil” blog?
JDH
Of course, the conservative explanation is that this is the lagged effects of the tax cuts implemented by Reagan in the 80s, and the continued effect of the new tax cuts implemented by GWB.
Believe it or not outside the world of academia, the above are widely held to be fundamental truths.
My (slightly more subtle) thought is that the deregulation begun under Carter but continued by the Reagan, left industries open to the sorts of productivity increases that IT can bring. I’m thinking here of WalMart’s famed distribution system, the deregulation of the securities industry etc. From a McKinsey study around 2000 and Robert Gordon’s work, it appears almost all the productivity gains have been in 3 areas:
– retailing – the move to big box stores and especially WalMart
– securities – the move online eg Schwab (but also in the wholesale financial industries)
– computer manufacture – eg Dell and Cisco (dematerialised, build on demand production)
I would guess the rise of Southwestern Airlines and its imitators as well? The productivity gains in railroads (as opposed to ports, where unionisation has restricted the use of technology) have been nothing short of phenomenal.
The world attributes too much accuracy to the productivity number,imho. One can argue that the starting point in the 1947-73 period was skewed toward a higher number as the U.S. economy was transitioning from war-time production to civilian production with new equipment giving a strong boost to productivity in the early years.
One problem with productivity data is how to measure it. It’s relatively simple to divide the number of cars manufactured by the number of wage-hours and get a number. But how do you measure the productivity of an opera singer?
How do they measure the productivity of a lawyer? The service sector is difficult to measure but yet is becoming an ever-larger portion of the U.S. economy. The productivity number becomes more suspect.
Maybe higher productivity isn’t desirable in many cases. At the risk of upsetting our host, how does one measure the productivity of a university professor? If it’s based on the number of students taught, then larger class size becomes desirable yet the conventional wisdom says that smaller class sizes are best.
And how do we measure productivity in terms of quality of life? I retired at age 52,thanks to my investment prowess 🙂 To the extent I and others like me are reflected in the calculation,we’re a drag on the productivity numbers. But yet I’m a heck of a lot happier with my life than I was before. So for me less productivity is great.
As James Hamilton has pointed out, the proliferation of computers in service industries has increased productivity. It is also the case in manufacturing. Also, more competition from outside the USA has forced domestic manufacturers to increase productivity. I would like to introduce an additional reason, which is possibly politically incorrect: With the breakdown of physical segregation between whites and minorities and whites in many areas choosing to send their children to private schools, whites have been motivated to work harder in order to economically segregate from minorities.
Paul Ratliff
Isn’t there a productivity bonus not measured in the data. That noted by McKinsey and Gordon being the many quality improvements that extend useful lives, enhance user performance and enjoyment. Has anyone made a stab at the impact?
Log of nonfarm prod/worker, A log of farm productivity per worker shows an even sharper rise.Laser guided and computer controlled field leveling, irrigation, info on planting,selling,pest control,etc has moved 64 out of 66 people off the farm for each 100 fed.Those freed up people are providing services and making goodies that make all of our lives easier.
I learned to “drive tractor” when the average farm tractor was 25 to 40 hp. Now my kids learned to “drive tractor” on machines that are 125 to 150 hp. Processes that used to take several days on a field now take several hours. Huge advance in agricultural productivity per person in my lifetime, mostly enabled by advancing technology.
But with diesel approaching $3 per gallon, with those tractors burning upwards of 60 gallons in a long day, with the cost of energy being 40% of the cost of raising alfalfa in previous years and with feed cost being half the cost of milk before it even gets to the farm gate (on average more energy is invested in food post-farm gate than pre-farm gate), it seems to me that we have a big food cost problem heading our way.
The desegregation argument is politically incorrect, but very interesting. Would make for a very interesting book. Whites (particularly those on the left) have worked so hard to desegregate society. The only thing they have worked harder on, is to make sure they have no interaction with minorities. I see this in my city of Chicago. But, it causes so much inefficiency. Traffic jams since whites have to drive everywhere because they won’t live in the city etc. (Last census, Cook county lost among the most people of any county in America.) The economic effects of legal desegregation and the resulting segregation through economic life choices (urban sprawl) etc. should be examined closely.
Paul, I’d worry about the desegregation hypothesis being not politically incorrect but just plain incorrect. Personally I have a preference for hypotheses that can be quantified and challenged or confirmed directly with the data. All of the theories I discuss in my post are things that people have tried to measure in as quantitative and rigorous a way as they can.
I’m wondering about the impact of outsourcing on the productivity statistics… For example, a company might get a contract in the US, and then use a combination of US and foreign resources to complete the work. So the number of US employees involved is less than in the old days (if it was all US labor), and indeed the negotiated price is lower (since both parties are aware of the outsourcing). But it would seem that the full output and the full revenue would be counted as US figures. So it would appear that the US labor is magically much more productive.
Or are there various types of adjustments that try to measure and correct for this?
I’m just reading After the New Economy by Doug Henwood, which disputes the fact that something special is happening. More important he shows that higher productivity does not seem to result in higher wages and better living standard, not for the poor and not for the middle class.
Productivity Trend
James Hamilton writes, Between 1995 and 2004, U.S. output per worker grew at a 2.9% annual rate, even faster than…
I am not an economist! So I humbly ask:
Wouldn’t there be an impact on the productivity of the american economy as a whole as it moved from manufacturing into services? And what about the increase in usage of imported parts in manufacturing – certainly in place of less competitive industries?
A discussion of offshoring and BLS productivity measures can be found at:
http://www.bls.gov/lpc/lproffshoring.pdf
Basically, imported services (like call centers) or goods (something manufactured abroad) are subtracted from the measure of output, and should have little influence on the BLS productivity measures for the nonfarm business sector.
As for measuring productivity in the service sector, yes, this is one of those important “other” hypotheses I mentioned that have been discussed in the literature, and it may have made some contribution. However, the move from manufacturing to services is a very long-term trend, so it is not clear how this could produce first a slowdown in productivity growth in the seventies and eighties but then an acceleration over the last decade.
“So why doesn’t that(productivity gains)get more attention in the press?”
’cause the press knows that in order to portray a ‘crisis’ in SSI & thus leave the door open for the republican’s plan to eliminate said program the conventionl wisdom must be that productivity sucks (<2%), no?
In the nineties everyone was talking about the arrival of the “new economy” where the effect of computers did show up in the productivity statistics. But then came the crash at which point it became clear that the new economy had been oversold, in large part by the press. So now the press is probably tilting towards the other extreme. The funny thing is that – if the statistics are to be believed – the new economy really is here now, but nobody dares to talk about it anymore. Quite a reversal from the nineties
The last last five years represent an extreme experiment in US macroeconomics. The Federal reserve lowered fed fund rates after March 2000 to around one per cent . LIBOR loans, ARM’s, and non principle payment loans remarkably amplified the effects of these ultra low interest rates resulting in an echo housing bubble of greater magnitude and much greater private citizen import than its immediate information technology predecessor. Hundreds of thousands of construction, real estate, and mortgage processing jobs have been created. The profound tax cuts lowered federal revenue collections to multi-decade record percentage lows of the GDP and placed billions of dollars back into the able spendthrift consumer hands. Wartime borrowing and spending created hundreds of thousands of jobs for both lucrative civilian contracting at-home and in-theater support and back-fill positions of reservists off to war for 12-18 months at a time. Low cost foreign manufactured goods were imported by debt driven dollars at a rate of 4-5 percent of the GDP per year. Emerging from all this incredible stimulation and imbalance, the American real GDP eked out an average 2-3 percent growth over the last five years. So much debt for so little gain.
What would have happened if the variables of the grand experiment were changed? What would have happened had fed funds rate been lowered to only two and a half percent at the nadir or if tax cuts were only given at a rate of 50 percent of the actual and only to those earning less than 60, 000? What if there were intelligent and proactive regulatory guidelines requiring 15 percent down on housing and requiring payment on the principal? What would the effect have been had 300 billion not been spent on operation Iraqi Freedom? Finally, are the gains self sustaining? Was the debt incurred worth the GDP gain? Will the ‘investment’ in the current years translate to continued growth in the out years?
The common denominator for all of the growth that has occurred in the last five years is not new self sustaining capital investment in machines, nor in equipment, nor in R and D, nor in improved public works, water, roads, or energy, nor in productive entrepreneurship. The common denominator in the five years of anemic resuscitation of the US GDP has been through the common end process of maximal facilitation of federal and private debt creation for a one time bang. Federal deficit spending and private debt accumulation, the latter related to unimaginable – referenced to wage income – bank, GSA, second mortgage, and credit card borrowing for housing, leisure, and the 700 billion a year current account deficit spending, have been firing on all eight and one half cylinders. Gasoline had been poured onto the smoldering and dying 2002 NASDAQ ashes that turning into charcoal after the saturation point of the tech bubble had been reached in March 2000.
The over-stimulated economy is now at another saturation point with regard to housing, equity and the leading commodity entities. Many pointing out global productivity gains fail to realize that it is ultimately overcapacity that is driving workers out of individual areas resulting in those productivity gains.
Fractal analysis of market valuations and saturation macroeconomics suggest that the next few months will involve a phase transition of historical magnitude. The economic imbalances; the high or near highs in equities, certain commodities, and the housing bubble arena as well as the intermediate highs in the short term and long term debt markets; and the relative over saturations of markets, forward consumer consumption, overcapacity, record private, corporate and governmental indebtednessed, US historical null savings, and market euphoric optimism suggest that the timing for such a fractal phase transition should and will not, retrospectively, be inappropriate or unexpected . For linear thinkers and market analysts looking at the continuous and ever steady progress of a infallibly expanding money supply and its dependent recipient incresing market valuations, this might be a time to reevaluate – and – expect the unexpected. Gary Lammert http://www.economicfractalist.com/
How does the BLS (or the BEA) value such things as call center services for customer support, whose value to the consumer is an intangible part of the value of the product being supported? If it values them at cost, offshoring is likely to exaggerate productivity, because the true value of the offshored services is being understated, and as a result more value is being attributed to the part that remains domestic. (The opposite effect might be present if the manufacturing process is being offshored.) I remember being concerned about this in late 2003, when we were seeing almost absurdly high productivity growth and hearing a lot of news about the offshoring (specifically) of call center services. The BLS article cited above only applies to the period through 2001.
But actually, increases in productivity *do* effect employment, but just not our measure when we say “unemployment.”
The industrial revolution meant that child labor and over-elderly labor weren’t needed. But no one wept when they lost their jobs. Similarly, the shift to a 40-hour work week should be considered a drop in employment.
I’m sure that productivity improvements will continue to have effects on employment… and I think to state it most correctly, we should say that we think it won’t affect *voluntary* employment.
Nice
This is the most important – and best – news I’ve heard today: U.S. productivity began to grow quickly again in the late 1990’s, and there now are enough data to suggest that this change is for real. Between…
The Most Important Economic Statistic: Productivity
Economist Arnold Kling, formerly a staff economist for the Fed’s Board of Governors, says productivity statistics should get the most weighting in the President’s economic briefings. Another well-spoken economist, James Hamilton, explains in his bl…
What I’ve to say is not based on data but rather on ground level observation. Beginning in the late seventies and accelerating through much of the eighties I and many another, were busy bees automating manufacturing facilities. Depending on interest rates, capital availability, etc., these were either new plants or retrofits. For all the retrofits I did, and these numbers hold across the board for others like myself, the plant’s production line work force was reduced by 75%, i.e., the retrofitted-automated process took only one-fourth as many workers, and production (output) was increased by 40%. Food processing, automobile mfg., …. all the same. By the late eighties offshoring began to take it’s toll, so that today, even with the increased efficiency, almost none of the some two-hundred plants survive. These jobs were all good paying union jobs. Jobs that weren’t replaced by good paying jobs.
Further, I think that many, many workers were simply disappeared from the data tables in the rust-bucket seventies, again in the hello homeless eighties and are being so again today by increasing the ‘no longer seeking employment’ grouping.
Regarding “higher productivity does not seem to result in higher wages and better living standard”, I think misses the point that the same wages buy better things today, plus the fact that while wage growth is slow, total compensation growth continues, it is just being diverted to benefits.
Look around. New houses are better than old houses. New televisions are better than old televisions. All consumer technology products are better than old ones, and cost less as well. Almost all consumer products cost less today, especially if you adjust for inflation.
I know people under the poverty line who have computers, microwave ovens, and surround sound. Many of these people came from real extreme poverty…in Central America, where none of that would have been possible in their lives. They certainly are doing much better then their friends back home.
Housing costs are high, but as I mentioned, we really do live in better homes, and it is only recently that homes have been costing more per square foot than in the past (adjusted for inflation), plus I suspect that after the housing boom the trend towards reducing cost per square foot of housing will return.
Medical costs are also high, but it is because medicine is more effective today and can treat more illnesses. That and the fact that government pays over 50% of all medical costs…
Still if you are sick and can’t afford US care, look into medical outsourcing travel to Central America or India where there are plenty of good deals on medical care.
Is the number basically the same between productivity/hour as productivity/worker?
Coach, the average workweek has a steady downward trend (falling from 38.2 hours per week in 1964 to 33.7 today), but because this trend is so gradual it has no effect on these calculations. Hours per week declined by 0.4% per year from 1964 to 1973, by 0.3% per year from 1973 to 1995, and by 0.2% per year from 1995 to 2005. To get the average annual change in output per worker from 1995 to 2005, you’d take the average change in output per hour (+2.9%) and add to it the change in hours per worker (-0.2%) to get +2.7%. In other words, the answers are basically the same whether you’re talking about output per hour or output per worker.
To the extent there is a difference, output per hour is the more meaningful measure, because one of the ways that people can (and have) take advantage of the increased productivity is by working shorter weeks. Output per hour is the measure of your ability to do that.
I’m curious to know how global corporations are accounted for in the output statistics. For example, in Silicon Valley, most companies now have sizeable engineering operations in India – in some cases even the majority of the staff. This is a trend that’s accelerated hugely in the last five years. These Indian operations might be subsidiaries, or they might be contract houses, but the parent company is a US corporation. Manufacturing will be primarily done on a contract basis in China, Korea, etc. So the output per *US* worker has increased a lot in the typical Silicon Valley company, but the output per *total* workers has probably not (there are significant communication overheads in a distributed operation, for example).
How would such companies get incorporated into the national statistics? (Please excuse my basic economics ignorance of how the statistics are compiled).
Stuart.
I took a look at
http://www.bls.gov/lpc/lproffshoring.pdf
suggested above. It’s full of general reassurances, but I can’t find anything specific to get a grip on. When a US company has an overseas subsidiary, how does the BLS decide how much output should be credited to the US economy versus the overseas economy?
Stuart.
Stuart, the measure of output of the firm is reduced by the dollar value of any goods or services that are purchased from overseas sources. The productivity figures refer to this net output measure (more accurately described as the domestic value added) divided by domestic labor input.
JDH:
In the case of a contract outsourcing arrangement, I can see this makes sense. In the case of direct subsidiaries, though, how does the BLS know how to assign $$ value? If they just subtract off the expenses associated with the overseas operation from the revenues of the US corporation (as opposed to say allocating corporate revenues to the two countries in proportion to expenses in the two countries), that is going to have a flavor of having all the entrepreneurial profit in the enterprise allocated to the US. Thus recent productivity growth could be seen as the US increasingly being owners of multinational corporations, which increasingly have their operations elsewhere. Good for US elites, but not for ordinary citizens.
Even in the outsourcing to an overseas firm case, the US firm, if successful, can probably get higher margins than the overseas firm which is providing labor in a rather commoditized market. Thus “productivity” increases may not really be worker productivity per se, but rather economic leverage of the parent company. Not saying that’s bad per se, but it’s not quite what people usually mean when they say “US workers are more productive”.
Stuart.
Some Call It A Bonfire/Carnival Of Classiness…
We call it “Classiness, All Around Us.” Click to explore more WILLisms.com. In no particular order, WILLisms.com presents classiness from the blogosphere (100% more classy, this week only!): 1. Vietnam Syndrome- WunderKraut examines the Left’s obsessio…