Some thoughts on the latest trade price data.
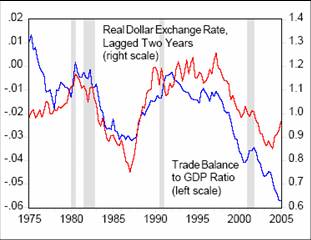 |
There has been some speculation that, with the huge September month-on-month increase in import prices (corresponding to a 27.6% logarithmic annual rate), the long-awaited adjustment of the current account
deficit has begun. Greenspan conjectured that the current account
was set to stabilize, but that hope was predicated on import prices rising with the falling dollar. The figure at the left (which plots year-on-year changes) seems to provide some hope, but it’s important
to distinguish between the rise attributable to rising energy import prices and that due to rising non-energy import prices. Non-oil import prices seem to have risen much less: the month-on-month annualized increase
was 14%.
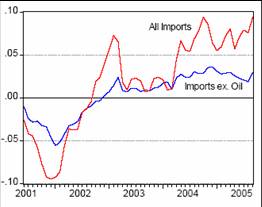
The response of price changes to changes in the exchange rate is called pass through.
The next figure illustrates this relationship between non-oil import price changes and the dollar exchange rate expressed as US$ per basket of foreign currency units (Fed Broad Index). Once again, each change is expressed in
year-on-year changes.
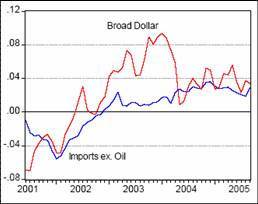
It’s hard to see that import price (ex-oil) inflation has picked up on a sustained basis. (A cautionary note: Bloomberg identifies the non-oil import price increase as due to natural gas price increases). But a more careful analysis is required in order to
discern increased pass through. Consider the underlying relationship:
where Pimport is the import price, S is the exchange rate (measured as $/foreign currency unit),
and Pforeignexport is the export price of the foreign country (measured as foreign currency unit per good).
Log the variables, take first differences, posit exogeneity of the right hand side variables, and one obtains the
standard pass through relationship. Careful and extensive studies by the Fed and others has demonstrated that in recent years, exchange rate pass through
has declined from about 0.50 to 0.20.
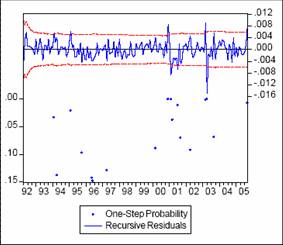
Using BLS end-use monthly import data over the 1989-2005 period, I conducted a quick and dirty analysis (omitting foreign prices), regressing the change in non-oil import prices on current and twelve lags of exchange rate changes and twelve lags of import price changes. I find that the first two lags of
exchange rates’ coefficients sum to 0.20. If there is a break from the previous relationship, it might show up as a statistical break. The figure below illustrates the one-step ahead forecast residuals test for this regression. There is a break in 2005.09; but there
are also breaks in 2001 and 2003.
Examination of recursive estimates of the relevant coefficients indicates little evidence of a rise in exchange rate pass through.
Of course, this is only one month’s worth of data, and there are many flaws in the analysis (foreign prices are not included, for instance).
Perhaps more important, the assumption that the exchange rate is exogenous is problematic. Exchange rate depreciation and price inflation are both partly
monetary phenomena.
So, short answer, it’s too soon to say whether the adjustment process is underway.
I wonder if there are decent options for including the foreign export price in the equation? Presumably this could improve fit and forecasting ability, but represents a hefty data challenge.
I’ve seen efforts that are based on aggregate export price indicies from major trading partners. But I think most people do what you have done above and just leave them out.
I wonder if for fairly non-differentiated goods, it would be useful for somewhere like the IMF to compile “world trade price indicies” at a fairly disaggregate level (2 or 3 digit – e.g. oil, gas, chemicals, aluminum, fruit). Countries could weight these appropriately for their import basket and use them when constructing indicators for at least part of their foriegn currency denominated import prices.
Amendment: I see the Fed study referred to has made use of a dataset of the sort I referred to for pure commodities. I guess I wonder how much better these regressions would be if the world price dataset included more fairly non-differentiated manufactured goods (hard drives? CRT monitors? wooden furniture?). I’ve worried in the past about using foreign CPI/PPI as a proxy.
Even if you are looking at non-oil import prices you have to be very careful using import prices because of the composition of import prices.
Much of trade prices are dominated much more by industry specific factors rather than currencies.
For example, industrial comodities excl. oil are 15% and such things as copper prices dominated by industry supply and demand factors, not currencies.
Likewise, Info tech equip is also 15% of imports where falling prices reflect industry specific factors rather then currencies. Another 15% is autos where the trade is largely intra-firm transfer prices — like GM and Ford moving parts back and forth between the US and Canada.
So when you get right down to it currencies probably have a significant impact on only about a quarter of import prices. That roughly corresponds to the category — consumer goods excluding oil and autos.
Another way of putting spencer’s point is to say that most non-oil commodities and some manufactured commodities are priced in dollars. So a question is how well the pass-through equation above is able to cope with pricing to market behavior by commodity producers
Thanks to all for your comments. As David Hargreaves notes, a foreign variable should enter. Actually, unless one is estimating an identity, then one should include some cost variable. In the early Hooper and Mann papers on pass through (BPEA, 1989), they included domestic demand factors such as capacity utilization and foreign marginal cost as proxied by unit labor costs (ULCs). This was possible as long as one considered most U.S. imports as being sourced from countries for which ULCs are available. With China, as well as the other NICs entering into the fray, this is a less tenable proposition.
In any case, in all these exercises, data constraints are everywhere (in fact, many times the import price is a unit value index, which does not control for quality, yet another problem).
For those interested in these issues of modeling disaggregate trade flows, I highly recommend Cathy Mann and Katherina Plueck’s working paper on the subject:
http://www.iie.com/publications/wp/wp05-11.pdf
Spencer and RF have raised the debated issue over whether local currency pricing (LCP) or producer currency pricing (PCP) dominates. This in turn is related to, but not the same as, the empirical question of invoicing currency. On pass through and pricing, Jose Campa and Linda Goldberg argue for micro factors as important:
http://www.nber.org/papers/W8934
Valderrama concurs:
http://www.frbsf.org/publications/economics/letter/2004/el2004-21.html
On the other hand, there are many others who argue that macro factors dominate.
Gagnon and Ihrig represent an example of the macro/monetary view of the determinants of pass through:
http://www.federalreserve.gov/pubs/ifdp/2001/704/default.htm
So I’m confused. Given that most of the increase in import prices is due to energy (so far), and demand for energy is pretty inelastic in the short term, and we are extremely supply constrained for domestic energy in both the short and the long term, I would expect that what we will collectively do is just pay the extra and this will increase the trade deficit, not decrease it. Since our debt/GDP is still a very modest fraction of say, Japan’s, we can keep this up for a long time yet, no?
Stuart: (1) import prices ex oil do not seem to have risen on a sustained basis yet. (2) Oil, being denominated in dollars, is even less susceptible to dollar movements. Hence, your conclusion in the short run we will pay a little more for total imports is correct. However, the next step you make, that the debt/GDP ratio is small, is one I’m not certain of. The US government debt to GDP ratio is relatively low at 38% at end-FY2005, compared to around (net) debt/GDP of around 85% in Japan.
However, what matters more is not the government debt, but the country’s net debt (private and public) relative to the rest of the world. Here, the U.S. is at about 21%, likely to rise to about 27% this year. Japan in contrast is a net creditor. The trajectory for this ratio is looking pretty bad, as long as the current account deficit doesn’t shrink substantially (at 6.5% of GDP this year, over 7% next year). The question is then how willing the rest of the world is to send $700 billion dollars (and more) of savings to the US each year. As our indebtedness grows, I argue they will become less willing, at current terms (i.e., these low interest rates).
I have the feeling that it’ll end very badly. No one is trying to break this unhealthy pattern. Bretton Woods II is like mutually assured destruction during the nuclear deterrence era. And, the worst part is that we don’t have any key personalities pushing for SALT III, Plaza Accord II, or any such like. People seem to be content in just letting things build and see what happens.
Menzie Chinn — “the country’s net debt (private and public) relative to the rest of the world. Here, the U.S. is at about 21%, likely to rise to about 27% this year.”
What’s your source for the 21% figure?
Emannuel: It could end badly, or just kind of badly. In some sense, the worst scenarios involve very bad repercussions abroad. The US financial system appears pretty resilient, Refco notwithstanding. But if US real interest rates spike, that will drive down stock prices and up sovereign debt rates in emerging markets. That may lead to financial crises abroad, or at least recession induced by financial retrenchment.
On the positive side, at least some Republicans are now talking about fiscal restraint — albeit of a very modest amount right now (all trivial spending cuts, and no tax revenue enhancements).
Movie Guy: The number that is cited is the Net International Investment Position for end-2004, with Foreign Direct Investment valued at market rates, divided by U.S. GDP.
http://www.bea.gov/bea/di/home/iip.htm
In the past few years, with the dollar depreciating, the U.S. has benefited from “valuation effects” — the fact that most U.S. assets held abroad are denominated in the euro against which the dollar declined from February 2002 to end 2004. Since the dollar has appreciated since the beginning of this year, this valuation effect will not be present this year, so pretty much the full 6.5% of GDP will feed in along with the dollar appreciation.
Correction: I thank the NY Fed’s Linda Goldberg for pointing out that I provided an incomplete and potentially misleading description of the results of the Federal Reserve Board’s pass through study:
http://www.federalreserve.gov/pubs/ifdp/2005/833/default.htm
While the direct effect of pass through from foreign prices in dollars has declined to 0.20 for all goods, this pass through coefficient remains somewhat higher for goods ex-commodities: above 0.30, with the top end of the plus/minus 2 standard error bad at about 0.45.
Alternatively, taking into account the indirect and indirect effects of dollar changes on commodity prices, one obtains a point estimate of exchange rate pass through on non-commodity import prices of about 0.25 (rolling regression estimates of both of these parameters are in Exhibit 2 of this paper).