Little sign of the reversal in the trade deficit.
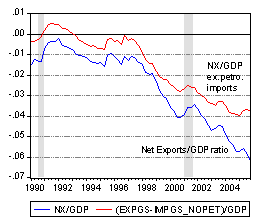
As many readers of this blog will recall, in February of last year, Chairman Greenspan saw prospects for the stabilization of the current account and by implication the trade balance (here used interchangeably with the term “net exports”) to GDP ratio.
In addition to the somewhat troubling aspects of the latest GDP report (see Jim’s post on this issue, and the graph indicating the negative contribution of imports to growth; Brad Setser has a post on the release as well), there is little evidence this stabilization is at hand, except perhaps when oil imports are excluded.

Source: BEA, Jan. 27, 2006 release.
Now, admittedly many of the conditions that Greenspan listed — for instance fiscal restraint — have not come to pass. So rather than merely recounting the march downward of the trade balance to GDP ratio, it might be useful to reconsider how strange the current experience is relative to the 1980’s episode of dollar depreciation.
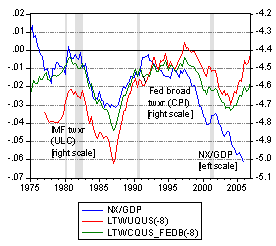
The next figure presents an updated version of a graph that will be familiar to readers. It shows the trade balance according to the NIPA definition, against two measures of the dollar exchange rate lagged two years. The first measure (in red, marked “IMF”) is the dollar exchange rate against a basket of other industrial country currencies, adjusted for unit labor costs (ULC)), and the second measure (in green, marked “Fed broad”) is the Fed’s CPI deflated measure against a broad basket of currencies associated with the United States’ trading partners). (The exchange rate indices are logged, and expressed so an increase in the variable is a depreciation.)

Source: BEA for net exports and GDP; IMF International Financial Statistics and Federal Reserve Board for exchange rates.
During the 1980’s episode, the trade balance improved after the dollar depreciation, measured using either measure of the dollar exchange rate. In the most recent episode, we would have expected the trade balance to improve sometime in 2004. Indeed there has been some improvement — or lack of deterioration — on the non-oil trade balance, but even on that count, one would have expected greater improvement.
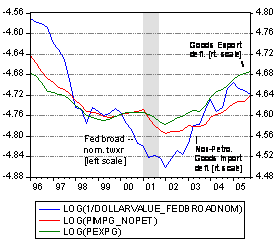
Some observers have pointed out that pass through of exchange rate changes into import and export prices has declined. This has been the subject of numerouse studies in central banks, including one voluminous study at the Fed. However, a quick glance at the trade weighted nominal exchange rate indicates that there has been some pass through (that is non-oil import [in red] and export [in green] prices have responded somewhat to the dollar depreciation [in blue]).

Source: BEA and Fed. Fed dollar exchange rate is logged and in nominal terms, base year 1995.
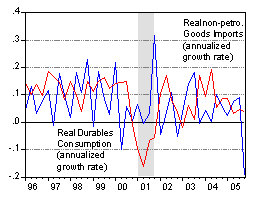
Of course, not all other things are held constant. As has often been observed, US economic growth has exceeded other countries. In particular, US consumption growth has been quite rapid (due to housing equity withdrawal and tax cuts), and predictions of a stabilization of the trade deficit/GDP ratio implicitly or explicitly rely upon a normalization of consumption patterns. The most recent GDP release indicates that this process may be just beginning. The next figure presents annualized growth rates (calculated as log first differences of the underlying series) of real durables consumption {blue line) and of real non-oil goods imports (red line).

Source: BEA, and author’s calculations.
That being said, it is still remarkable — to me — that non-oil goods imports only decreased slightly despite the sharp drop in durables consumption. That tells me that if the adjustment process is underway, it’s at its very initial stages.
Technorati Tags: trade deficit,
dollar value,
consumption
Menzie — I am a little surprised that you are surprised by the absence of a stronger response, for three reasons:
1) the dollar isn’t that weak. the broad real dollar (http://www.federalreserve.gov/releases/h10/Summary/indexbc_m.txt) is still 10% or so above where it was in early 97. And back when i was looking at models seriously in late 97/98, the early 97 level of the dollar was consistent, given average US and world growth rates, with a slow deterioration in the trade balance. the shift from 90 to 100 say produced an expected sharp deterioration in the trade balance (as observed) and then a faster trend deterioration. That assumed different income elasticities, and I know you have worked to update those numbers. But the conclusion I took from that is that a real dollar of below 90 on the fed index is probably needed to really stabilize the US trade deficit.
Eyeballing the data, the fall in the dollar since 2002 does seem to have contributed to a slowdown in the pace of deterioration in NX (largely through relatively strong US exports in 04/05). So it did have some impact. Just not a big enough impact to overwhelm everything else. The level presumably matters as well as the change in the dollar, and the old model I was using certainly wouldn’t predict (based on data from say 70 to 97) that the current level of the dollar would generate sustained improvements in the deficit.
2) A lot of other things happened in the late 80s as well. Europe boomed, Japan bubbled, the US even consolidated its fiscal somewhat … I don’t put as much emphasis on the absence of a European boom now as some, because right now china certainly is booming far more than europe did in the 80s. But it hasn’t been — to date, a consumption led boom …
3) The world has changed since the 80s. Emerging markets matter far more, and their currencies haven’t adjusted recently. they are still quite depreciated compared to say 97. China has depreciated in real terms v. the US b/c of inflation differences, when productivity differentials suggest a real appreciation etc. I suspect that the weights in the fed index constantly lag China’s booming share of US imports. And the US has a far smaller tradables sector now than in the 1908s I suspect. Certainly a far smaller manufacturing sector.
All in all, I suspect a real swing in the trade balance (trade balance ex-oil) will require:
a) A further fall in the dollar, particularly v. emerging economies. I suspect a real dollar in the 80s on the fed’s real dollar index will be needed to produce a trend reduction in the deficit.
b) A slowdown in US consumption … and a surge in consumption in the high savings emerging world. In other words, the reverse of what we saw from 02-05. 04/05 were not periods of slow global growth. But too much of the impetus for that growth came from a surge in US consumption relative to US income.
c) A bit of time, as the dollar needs to fall to the point where folks decide that “platform companies” need to source more production in the US, and need to invest in the US to generate … I would not be surprised if there is a bit hystersis, i.e. investment in the US tradables sector hasn’t been strong enough to allow the US to ramp up exports all that quickly … and there needs to be a period of windfall profits for US based tradables producers based on a weak dollar to change investment patterns and generate the capital stock required to take advantage of the weaker dollar/ shift in global consumption patterns.
Sorry for the long comment.
Brad: Thanks once again for your excellent insights, and pointing out some omisssions in my exposition. Let me address your points in sequence.
1) The dollar isn’t really that weak. I agree — my point was that the lagged effects should have shown up in 2004 and 2005, and the resumed appreciation of the dollar in 2005 should not have shown up fully. That bodes ill for the future course of the trade deficit.
a real dollar of below 90 on the fed index is probably needed to really stabilize the US trade deficit. That conclusion relies upon some assumptions regarding the level of economic activity at home and abroad (and the composition of the spending — see my post on trade elasticities). My surprise is that, given the slowdown in GDP, durables consumption and deceleration in equipment investment growth, imports continued at such a rapid pace.
2) A lot of other things happened in the late 80s as well. Europe boomed, Japan bubbled, the US even consolidated its fiscal somewhat… Agreed. This explains the trend in the trade balance, despite the fact that the dollar is according to most measures weaker than it was in 1985. As I said, my surprise is the lagged exchange rate effect is largely absent or muted, and that, at the higher (q4) frequency, no improvement in the trade balance, either total or ex. oil imports given the drastic slowdown in GDP (or final sales of domestic product) growth.
3) The world has changed since the 80s. I agree fully; this is why I included both the IMF exchange rate measure (which incorporates unit labor costs, but doesn’t cover countries like China), and the Fed series (which does cover China, but unfortunately does not incorporate unit labor costs). I further agree that a large swing in the trade deficit (so deficit reduction rather than just stabilization) requires a realignment of income growth — with the rest of the world accelerating and the US decelerating. The very fact that consumption deceleration in 2005q4 didn’t result in some improvement in the trade balance is what — to me — was surprising (total consumption growth decelerated from 4% to 1.1% [SAAR, using log differences] going from q3 to q4).
Menzie — as usual, we fundamentally agree.
re: q405, I would note that import growth was below total consumption growth in q2 and q3. If you thought that was the lagged dollar, then the current acceleration is a bit of a surprise. If you thought q2 in particular reflected an inventory correction, its acceleration isn’t a total surprise. Particularly since that acceleration has been pretty clear in the monthly trade data.
re: the impact of a weaker dollar (relative to 00/01/02, not 96/97), your work convinced me that the impact of the dollar shows up on the export side, not the import side, and as I noted, export growth in 04 and 05 (on a y/y basis) has been quite good. over 10%. that is well above the trend growth of US exports over the past twenty some years.
That in a sense is what worries me — we did get the expected benefits of a weaker dollar. But the impact of a weaker dollar on exports was overwhelmed by other forces.
I see that my old boss (in some ultimate sense) Dr. Summers warned Davos about complancy, and likened 05 to 94. I say more like early 96/97, when EM spreads compressed post-Mexico and Asia was booming … that EM boom had shaky foundations. The 03-05 US consumption/ housing boom may too …