A primer on real, nominal, physical units, and seasonal adjustment
In my last post, I plotted the real and nominal series for oil imports. Some readers observed that it didn’t make sense to deflate the nominal value of petroleum and petroleum related products by the price deflator for petroleum and petroleum related products, since this yields a quantity. Why not just use the quantity of petroleum imports, expressed in barrels? The figure below illustrates why one should use deflators.
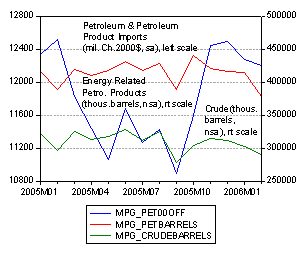
Real Petroleum and Petroleum Related Imports, millions Ch.2000$, seasonally adjusted, and Energy Related Petroleum and Petroleum Product Imports, thous. of barrels, nsa, and Crude Oil Imports, thous. of barrels, nsa. Source: BEA/Census, Feb. 2006 release, exhibits 11 and 17 respectively.
(The blue line is deflated quantity in millions of Ch.2000$; red line is all energy related petroleum and petroleum products, in thousands of barrels, and the green line is all crude oil imports in thousands of barrels). As can be seen, the series diverge. They diverge for a number of reasons, including the fact that the nominal (exhibit 9) and real (exhibit 11) series are seasonally adjusted, while the barrel counts are not. Perhaps as important, the composition of energy related petroleum and petroleum products is not homogeneous.
This issue becomes important whenever commodity classes are not homogeneous, which is usually the case, except for certain very specific and detailed categories (e.g., hard red winter wheat no. 1). Hence, just totalling up the physical number of units will not necessarily yield a time series identical in pattern to a “real” series (and indeed, the real series will differ depending upon whether a chain-weighted, Paasche or Laspeyres type price index is used). If the price index takes into account quality changes (as in the semi-conductor and information technology categories), then the deviations may be even more pronounced.
Now reader touche has advocated deflating oil imports by the CPI-all. Well, as one of my teachers in graduate school, George Akerlof, said, “nothing stops me from doing this”. But it’s important to understand that deflating by the CPI-all then yields a strange quantity, the amount of oil expressed in dollars per CPI bundle. One might be interested in this object, but I wasn’t — I wanted a quality and composition adjusted measure of the real quantity of oil imports. (What might make sense is the petroleum price divided by the CPI, which would then yield a relative price; even then, one would want to use the CPI ex-energy.)
Some other hazards attend the use chain-weighted indices. Real chain-weighted magnitudes cannot be added, while real magnitudes obtained by deflating with the CPI (which is base-year weighted, or Laspeyres, index) can be. An explanation of what one needs to do in this case is reported in this working paper.
Another difference is that the real series are seasonally adjusted and the physical quantity series is not. This is not a general rule, but happens to be the case in these instances. One could implement the X-12 seasonal adjustment routine on the physical quantity series, but the results would differ depending upon the sample used for estimating the seasonal parameters, among other things.
In a subsequent post, I will make some remarks on the differences in reporting trade flows between the Balance of Payments, Census and National Income and Product Account conventions.
Technorati Tags: deflators,
oil imports, seasonal adjustment,
chain-weighting
But it’s important to understand that deflating by the CPI-all then yields a strange quantity, the amount of oil expressed in dollars per CPI bundle.
Isn’t a deflator dimensionless? Dollars per CPI bundle now divided by dollars per CPI bundle then doesn’t yield dollars per CPI bundle.
Jonathan Lundell: Probably better if I’d been explicit. If I divide price of oil (in $/barrel) by CPI, then this is a relative price, expressed (conceptually) as the number of baskets of consumer goods (constructed with CPI weights) necessary to buy a single barrel of oil. If I divide the total value of spending on oil by the CPI, then this is the total bill for the oil expressed in baskets of consumer goods (where in both cases the number of dollars per basket is normalized to an arbitrary index of 100 in the base year).
Thanks.
What is it about economics, by the way? Is there another field with so many first-class practitioners blogging away at the rate you guys do, and in a way that we unwashed can, more or less, much of the time, understand it? I can’t think of one.
Something about the zeitgeist, vielleicht?
Interesting and useful post, even for financial professionals. thx
Menzie, the problem is that the deflated price of oil is not what people think it is. That is, they think it means one thing, but it means another.
It amazes me that economists still can’t figure out inflation. There is only 1 way to calculate inflation. That is, to add up all price changes weighted by market share, and divide by total market. No good or service can be “left out.”
This notion of “core inflation” is nonsense. An economic system has a nonlinear dynamic. Inflation can’t be resolved into “componenents.”
Let me make one final clarification.
The deflated figures are expressed in dollars, yet they represent an index adjusted volume. Usually when people see a dollar sign they think of how much they paid for something, not how much they got.
That’s my beef with these figures. They represent an index, but are expressed in dollars.
So your plot of nominal versus chain-weighted, is not a plot of how much we paid nominally compared to how much in Y2000 dollars, but rather a plot of how much we paid compared to how much we got.
The way the figures are presented makes this crucial distinction unclear. It confuses more than it illuminates. Maybe, this is done purposefully, I don’t know.
“a strange quantity … If I divide the total value of spending on oil by the CPI, then this is the total bill for the oil expressed in baskets of consumer goods.” What is so strange about that quantity? It answers the question, “How much did we give up in order to buy this month’s oil imports?” That seems like a perfectly reasonable notion of the “real value” of those oil imports. If you want to deal with oil in a macroeconomic context, isn’t that a reasonable way to remove the microeconomic aspect? (That is, oil is a specific commodity with its own market, but a macroeconomist would see it just as a bundle of “stuff” that we are disaggregating from the rest of the “stuff” for some reason. Oil as macroeconomic “stuff”, rather than oil as a specific commodity, could be quantified in terms of the more general “stuff” of the CPI basket.)
Jonathan Lundell and rfarris: Thanks for the compliments; I’m glad this was helpful to you.
knzn: Point well taken. Maybe I should’ve said “specific” quantity. I think my main point still stands — what you deflate, and with which deflator, depends on the question you want answered. I don’t think that macroeconomists necessarily are more interested in the quantity you were highlighted. In my case, I was merely trying to present a “real” or quality and composition adjusted quantity (and is exactly what BEA/Census reports in its trade release).