Where the ex. oil trade balance is going, and what trade prices are doing.
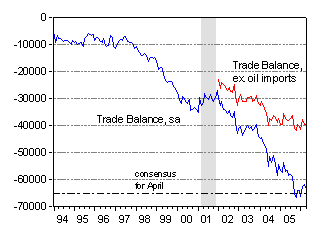
The BEA/Census released the April trade figures and the BLS the May export/import price figures this morning. The actual $63.4 billion deficit for April (seasonally adjusted figure) was below the Bloomberg consensus of $65 billion, while the 1.6% May increase in import prices exceeded the 0.7% consensus. Here’s Bloomberg’s coverage and below is a graphical depiction of the time series.

Figure 1: Total goods and services trade balance and total ex petroleum and petroleum products imports, seasonally adjusted. Source: BEA/Census, April 2006 release.
One noteworthy point is that the non-oil trade deficit has leveled off in nominal terms, so in terms relative to GDP, it has fallen. (Of course, what matters more — in some ways — is the trajectory of the total current account deficit relative to the supply of financing, and here we know the net income account is likely to go much further into deficit as interest rates continue their rise.)
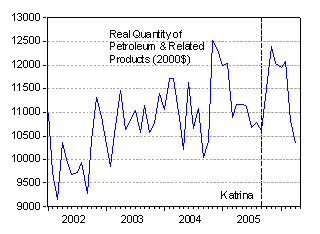
As I noted in my previous post on the March 2006 release, the drop off in oil imports was interesting. I also predicted a decline in the real quantity of oil imports (defined as nominal quantity of petroleum and petroleum related energy products, divided by the BLS end use price index for petroleum and petroleum related products; for a discussion of this measure, see this post). This is indeed what happened, according to Figure 2 below

Figure 2: Quantity of petroleum and energy related petroleum product imports, in 2000$, seasonally adjusted. Sources: BEA/Census April 2006, and BLS May 2006 releases.
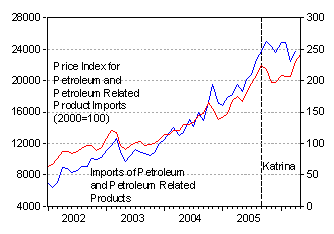
What about next month? Based upon the time series pattern exhibited in the past two years, expect the quantity of oil & related product imports to decline, even as prices rise; the May index for petroleum and related products rose 5.2 percent (see Figure 3). Something close to a wash for the value of imports may result. Of course, for June and particularly the subsequent months (August, September) of hurricane season, all bets are off.

Figure 3: Value and price (2000=100) of petroleum and energy related petroleum product imports, value seasonally adjusted. Sources: BEA/Census, April 2006 release, and BLS, May 2006 release.
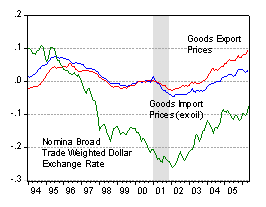
As indicated in Figure 1, the non-oil trade balance appears to be stabilizing. Continuation of this phenomenon requires both a moderation of growth in the U.S. versus the rest of the world, and expenditure switching. The latter in turn requires the prices of imports and exports to rise relative to other goods, which should happen as the exchange rate declines. We don’t have prices for these at the monthly frequency (because we don’t have prices for services as well as goods trade), but we do have goods prices. Figure 4 presents the time path (in logs) of goods import, export prices and the Fed’s broad trade weighted dollar exchange rate (expressed so a rise is a depreciation).

Figure 4: Goods Import (ex oil), Export price indices (2000=1) and Nominal trade weighted dollar exchange rate, all in logs. Sources: BLS, May 2006 release, and Federal Reserve Board.
What is remarkable to me is how slowly import prices are adjusting to the depreciation of the dollar. Part of this can be attributed to the hiatus in dollar depreciation in 2005. But this is also a manifestation of the oft-remarked low level of exchange rate pass through in recent years. Time will tell if the rapid depreciation in 2006q2 has a more marked impact in coming months, and indeed whether the low pass-through phenomenon persists.
Other commentary on the trade figures can be found at Calculated Risk and Brad Setser’s blog. Setser speculates on the sources of the decline year-on-year in the quantity of oil imports.
Technorati Tags: trade deficits,
oil imports,
oil prices,
pass through
Crude stocks are high, oil futures are in contango, summer drivers are checking tire pressures, last year’s storm damage has been repaired to about the limit repairs offer, I bet crude imports increase next month.
On pass-through: there are basically two ways exporters to the US can cope with the weakening dollar. Either they absorb these FX moves against them (to protect market share, for instance), or they hedge using derivatives. Maybe some of each.
Menzie,
With the European Central Bank looking to tighten, how does that potential event measure with the moderation of growth in the U.S.?
It seems as if these events would cause a slow down in the world economy.
Emmanuel: That’s correct — if import prices are not adjusted then either (a) the margins are reduced, (b) they’re hedged using derivatives, or (c) something else is changing, like productivity. On (b), Greenspan identified this as an important fact two years ago as a reason for the slow pace of price adjustment. But forward markets are only thick up to one year, so there is a question how much an effect this factor has at longer horizons.
Grzegorz: Tightening in the U.S. should slow down at least the U.S. economy, and other economies that link their currencies to the dollar. Those that float against the dollar should be somewhat insulated. On the other hand, the recovery in Europe and Japan is being driven by some structural — rather than cyclical/monetary policy driven — factors, so that also allows them some insuation from tightening U.S. monetary policy.
Of course, to the extent that both (Fed and ECB) central banks are responding to oil shocks, then the tightening is hitting growth in both regions.
Menzie — I am interested in your reading of the non-oil trade balance data. judging from the data, it has been roughly stable since 02, apart from one big slide in late 03/early 04 that took the non-oil trade balance down from $30b to $40b. it then stabilized. there looked to be a bit of improvement in early 05. there looked to be a bit of deterioration in late 05, but in broad terms, it looks pretty stable since the early 04 (late 03) deterioration. is that the right way to read it, or is the right way to read it a slow trend deterioration that has come in fits and starts. disaggregated, the non-oil import numbers show a similar pattern — big deterioration in 04. stability or even improvement in early 05 (looks like an inventory correction) and then a bad q4 and now stability to marginal improvement (with exports also more or less stalled for the past few months). what is your take on what is likely for the rest of the year?
my bet would be some resumption of non-oil import growth at a slowish pace (US slowdown) but also much slower export growth as the global economy slows/ the benefits of a $ in the 1.20-1.25 range (more or less where it has been since early 04) v. 0.90 and a civil aviation boom work their way through the data. I don’t quite see how the US sustains 10% (or more) y/y export growth (roughly twice the long-term average Wolf calculated) should the US and the world slow in the second 1/2 without a bit from the $. another view woudl be that the US will slow but the rest of the world won’t — europe and japan have their own momentum, the oil exporters won’t stop increasing their spending, and china’s efforts to cool its economy look sort of ineffective. thoughts?
Brad Setser: Good observations. I’m not sure I’m in a position to add to your points, except to note that the more pronounced the slowdown in U.S. growth, the bigger the improvement in the trade balance. I don’t look for much improvement in the non-oil trade balance to arise from lagged dollar depreciation, based upon the low estimated price elasticities for imports. Moreover, while faster growth in the rest-of-the-world should help, I’m not sure that our exports are concentrated in those places exhibiting more rapid growth (Europe, Japan). Catherine Mann and Katerina Plueck’s simulation results (working paper here) suggest that we shouldn’t hope for too much from accelerated output growth abroad. The burden for adjustment remains here in the U.S.
Very detailed analysis and informative webpage, liked the content.