Upside surprises. Will they continue?
The current account figures were released today. At -$208.7 billion was substantially less than the Bloomberg consensus of -$220 billion — although not substantially different than the median forecast from Informa reported in Monday’s Financial Times.
Since the trade figures were already known, the actual news was on the income and receipts side. Here, the account went back into the black (albeit slightly). This was partly attributable receipts rising faster than payments. Brad Setser has some interesting observations on why this might have occurred (including doubts about the data — remember these data get revised). One interesting insight on whether this process will continue is in this FT article:
“Income on overseas investments owned by US investors climbed to $140.8bn from $131.2bn. This was a faster rise than foreigners gleaned from their US assets and left a surplus of $1.9bn, compared with a deficit of $2.2bn in the fourth quarter. This shift is significant because the fourth-quarter data suggested the accumulation of US liabilities abroad was finally overwhelming the traditional premium the US earns on its foreign investments relative to the investments of foreigners in the US.
Brad Setser, an economist at Roubini Global Economics, said that the deterioration in the net income position would probably resume in coming quarters. ‘We did see an increase in the revenues Americans earned from foreign direct investment, and overall, US investors benefited from the rising interest rates because of the mix of their assets and liabilities.
‘However, there is no reason to believe that the longer-term trend towards a weaker income balance has stabilised.'”
To this I would add that “other private receipts” rose about the same amount as “other private payments”, so the big improvement was due to the swing in net payments on direct investment (as Brad Setser notes). The increase in “other private receipts” is suggestive, to the extent that it signals higher profitability abroad. As yesterday’s post indicates, this may in turn result in less incipient financing of the U.S. current account deficit. So good news in the short run, bad in the long run. And don’t forget, payments on U.S. securities have risen to -$32.9 billion, from -$19.8 billion in 2004q1, a mere two years ago. Since interest rates continued their upward trend over the second quarter, this entry should be yet again larger next quarter.
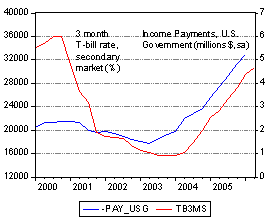
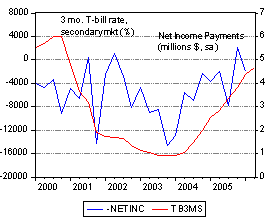
Update: Some time series graphs to drive home some points. Figure 1 is payments by U.S. government to nonresident holders of U.S. securities against the Three month T-bill rate on secondary market. Figure 2 is net income payments (i.e., negative of net income receipts) against the 3 month interest rate. Note the increasing correlation…

Figure 1: U.S. Government payments, in millions of dollars, quarterly, seasonally adjusted, against 3 month Treasury bill rate, secondary market, in percent. Source: BEA, 2006q1 release and St. Louis Fed.

Figure 2: U.S. net income payments on assets, in millions of dollars, quarterly, seasonally adjusted, against 3 month Treasury bill rate, secondary market, in percent. Source: BEA, 2006q1 release and St. Louis Fed.
Technorati Tags: balance of payments,
current account,
net income,
interest rates
My FT quote didn’t come out quite right — what i was trying to convey is that US lending abroad seems to be overwhelmingly very short-term (it is disproportionately cross border bank stuff in dollars), while US borrowing is actually a bit more long-term (there is a mix of bank liabilities and longer-term securities), so in the very short-run, a rise in US interest rates tends to increase the average interest rate the US receives on its lending a bit faster than it increases the interest rate the US pays on its borrowing. That has mean that the US income balance has deteriorated a bit more slowly than might have been expected.
The complication of course is the US lending abroad is far smaller than US borrowing. So rising rates meant that US interest and dividend payments increased by more (around $2b more) than US receipts. Rates + stocks …
what drove the data tho was the increase in US receipts on US FDI and the fall in payments on foreign FDI in the uS.