What are the implications of the current shape of the yield curve?
The yield curve is often used to summarize the interest rates on Treasury instruments of different maturities, with the yield plotted on the vertical axis against the time to maturity on the horizontal axis. In normal times, if you just know the average level and slope of this curve, you could predict the yield on a bond of any specified maturity pretty well.
The graph below, taken from Bloomberg, plots today’s yield curve. One glance at its odd shape lets us know that, whatever else is going on, these are not normal times. What should we make of the current serpentine pattern?
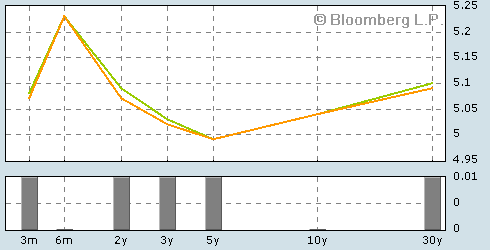
A starting point for any discussion about the yield curve is the expectations hypothesis of the term structure. This posits that, at any point in time, the differences in yields for different maturities are such that you can expect to earn the same total return regardless of which instrument you buy. For example, the current 3-month yield is 5.08%, while the 6-month yield is 5.23%. If the 3-month yield you could get in October turns out to be 5.38%, then you’d earn the same return from rolling over two 3-month bills as from buying the 6-month bill:
(1.0508)1/4 x (1.0538)(1/4) = (1.0523)1/2
Thus, according to the expectations hypothesis, the fact that the 6-month yield is currently 15 basis points above the 3-month yield means that investors expect the 3-month rate to rise another 30 basis points over the next 3 months
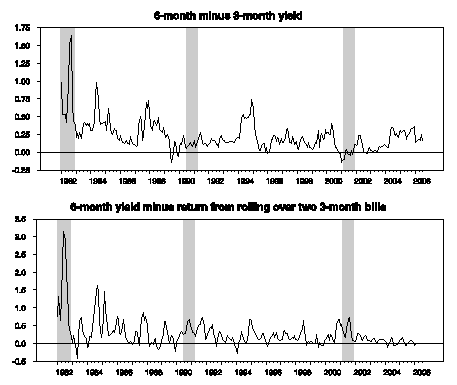
The top panel of the next graph plots the difference between the 6-month and 3-month tbill rates for every month since 1982; a positive value indicates that the 6-month rate was higher than the 3-month rate in that month. The bottom panel plots the difference between the return you’d actually have experienced six months later if you had (a) purchased the 6-month bill, rather than (b) purchased a 3-month bill and then bought a new 3-month bill three months later. Thus a negative value in the second panel indicates you would have ended up better if you had stayed with 3-month bills. The fact that this series is positive on average means that the yield curve usually slopes up and the longer-term security typically offers a little better yield.
 |
| Sample period | Estimation method | Standard error | |
|---|---|---|---|
| Coefficient | |||
| 1982:01-2006:03 | OLS | 0.96 | (0.096) |
| 1982:01-2006:03 | GARCH | 0.35 | (0.06) |
| 1990:01-2006:03 | OLS | -0.03 | (0.10) |
An ordinary least squares (OLS) regression of the ex-post holding yield (the bottom panel) on the initial spread (the top panel) and a constant for the period 1982:01 to 2006:03 produces a coefficient on the spread of 0.96 with a t-statistic around 10. If the expectations hypothesis were true, this coefficient should have been zero. Instead, the coefficient near unity suggests that the differences between the 3-month and 6-month rates have almost nothing to do with expectations of the future 3-month yield.
Although the expectations hypothesis has also been decisively rejected with data prior to 1982, the inference in the post-1982 data set is heavily influenced by the fact that interest rates are much more volatile at some times than others, causing the OLS estimation method to be overwhelmingly dominated by observations such as those in 1982. If one re-estimates the regression allowing for time-variation in the variance as captured by the GARCH model, the estimated coefficient falls from 0.96 to 0.35. And if one simply restricts the sample to the tamer period since 1990, with OLS the coefficient actually becomes slightly negative and completely statistically insignificant. Indeed, one can see in the second panel above that since 2000, the 6-month yield has been doing an almost perfect job of predicting the 3-month yield, consistent with the observation that the fed funds futures prices have not had much trouble anticipating recent Fed moves.
If we were to trust the expectations hypothesis at the moment, what would it tell us? The initial sharp upward slope suggests that investors expect one more Fed rate hike to come soon, perhaps the next meeting. But the fact that the yield curve then begins to slope sharply down suggests that investors are betting on rate cuts later on– otherwise, rolling over 6-month bills at 5.23% would beat any longer-maturity bets.
And what kind of scenario would have the Fed reversing course and starting to lower rates 6 months from now? Given recent inflation observations, it’s hard for me to imagine the Fed lowering rates in the near future unless we get a significant slowdown in economic activity that makes it worry a lot more about the prospects of an economic recession.
Such reasoning may be one of the explanations why a downward-sloping yield curve is often predictive of an economic slowdown or recession. I have mentioned the research by Jonathan Wright that calculates the probability of a recession based simply on the yield curve’s level (as measured by the fed funds rate) and scaled slope (as measured by the 10-year minus the 3-month rate). Plugging today’s values into the neat tool that Political Calculations developed for calculating the probabilities from Wright’s model, one arrives at a probability of a recession starting some time within the next 4 quarters of 39%.
And what if you’re not convinced of any of that? Well, if you’re buying Treasuries, by all means grab those 6-month bills. ‘Cause that’s the highest point on that funny-shaped graph.
Technorati Tags: yield curve,
interest rates,
Federal Reserve,
recession
Very nice clear explanation!
What Stuart said – outstanding!
JDH:
If possible, could you put up a single chart showing the CPI-U AND federal funds over 1970 through present, and a separate chart showing the real after tax yield on the Treasury 10 using any tax rate you wish (25%??) and CPI-U as the deflator over the same period.
An examination of these two charts should reveal some of what is underway here.
Thanks much.
Gene
JDH,
If
Nominal Interest Rate = Real IR + Inflation
and the following condition must be met for any rational investor
Real IR (i+1) GT Real IR (i)
then, for the negative sloping portion of the Nominal IR curve, inflation should comply with
Inflation (i+1) LT Inflation (i)
wouldn’t this be enough to certainly explain the concern over a negatively sloping yield curve? Since, in order to have deflation, prices would have to come down… and, some major braking would have to provoke this situation…
As a matter of fact, inflation would have to be negative at some points…
The extensive use of collaterized debt obligations (CDO) is lowering loan spreads to historic lows according to Bloomberg’s
http://bloomberg.com/apps/news?pid=20601069&sid=aYHl_WojnZFU&refer=fedwatch
“U.S. companies rated two or three levels below investment- grade paid an average spread of 1.59 percentage points more than Libor to borrow in April, a record low, according to S&P. The premiums, or spreads, have narrowed by half since 2003.”
Could the low spreads explain part of the expected decline in nominal rates?
One additional comment.
The S&P500 index is going nowhere, 1260 +/-, and volatility has been very low for quite a while.
This fact is explained significantly by the CDO environment.
On one hand, the CDO bond insurance industry protects itself by buying option puts of the underlying securities; which further reduces the market’s gyrations. On the other, companies have a reduced default risk due to the easier access to liquidity.
Which leaves the stock market sitting in very tranquil waters…
I don’t like it.
These tranquil waters come from many forms of obscure and entangled derivatives, hence dangerous…
The quieter it is, the larger the coming storm…
a volatility trade…
I keep this feeling in the back of my mind…
When you say, “Indeed, one can see in the second panel above that since 2000, the 6-month yield has been doing an almost perfect job of predicting the 3-month yield”, what exactly are we supposed to look at in the second panel to observe that?
Is it the fact that the line stays very close to zero? But I observe significant departures from zero in 2000 and 2001, about as big as most of the highs in the 1990s. I would say that only since early 2002 has the line stayed close to zero. Am I misunderstanding this graph?
Professor Hamilton,
I can’t seem to duplicate the 39% recession probability you mentioned. When I plug in the bond yields into Political Calculations tool I get 34%.
I am using the links provided on the site to get the current bond yields and the fed funds rate.
Should I be using different rates?
Thanks
Joe, you’re right that, if in six months we discover that this inflation fear was all just a bad dream, that would be a more benign scenario in which the interest rates might start coming down. I’m not sure that’s the most likely scenario here, however.
Hal, you’re right too. I really should have said since 2002 rather than since 2000.
GWG, Bloomberg at the moment is reporting the 10-year yield at 5.06, the 3-month yield at 5.13, and the fed funds rate at 5.25. Those numbers will give you 39%.
How can you discuss this topic without mentioning the volume of purchases of Tres. bonds by Asian Central banks & OPEC? They are supplying liquidity on the long end as the FED restricts it on the short end.
This inverted yield curve IS different.
Furthermore, I would assert that if those lending the US gov’t money at 5% for 10-30 years are doing so based on rational expectations, they should double-check their rationales. They are going to lose their shirts.
It is hard for me to read much into any of the interest rate data. Traditional relationships between the term structure and recession seem to have come undone. The long term rates of the past few years appear more an artifact of excess liquidity from the Fed bubble economy. Inflation has been roaring for several years, but the damped-down, derivative indicators the Fed follows have appeared subdued.
I do think the amount of long term damage created by the Fed liquidity is reaching a tipping point. Inflation expectations, and inflation, are firmly rooted in the world economy and show no signs of subsiding. The Fed’s inflationary bubble is encouraging violence and labor unrest in the commodity producing world, putting increased upward pressure on prices. Speculative interests still have unprecedented price setting power magnified by the financial steroids of cheap leverage and a non-existent regulatory structure.
I guess I can go along with the idea a slow down or outright recession may be in the offing.
The Fed has provided so much moral hazard insurance to the speculative community over the past decade, however, there is a good chance they will continue down the low road of easy money, risking even more inflation. Maybe the dip in term structure is just signaling a wager on a gutless Fed.
algernon,
…Where are your manners?
Anyhow, the question is:
If foreign CBs (TIC data shows that old blood is switching into agency and corporate bonds instead of Treasuries) and oil barons have the clear alternative to buy bonds from either end, short or long term, why are they opting for the long term bond that offers them a lower return?
…Greenspan’s conundrum.
The only rational explanation I can think of would be that they are afraid to forfeit their present opportunity to lock in the long term rates, because they expect the short and long term rates to fall drastically within the minimum bond holding period…
Weird… a conundrum indeed…
Joe Rotger,
Sorry. What was my offense? At any rate, I think you have right.
It seems inevitable that at some point that the US $ will fall significantly & long-term US interest rates will rise in proportion. All those Chinese “reserves” are almost guaranteed to shrink in value.
I have one more explanation.
Collateral.
Short term loans usually require less collateral; long term loans are larger requiring mortgages and so on…
When times are good banks ease short (and long) term lending standards. But, when banks expect a potential downturn they tighten and restrict more heavily their riskier short term loans, raising rates and denying loans; whilst banks tend to raise long term loans at a slower pace for the safer well collaterized loans.
Not even carry-trade players are willing to lend short term during times of duress.
…I’ll think of something…
In general, I have to agree with you… the USD should fall; although there are several situations that may well counter and hold the present situation quite indefinitely…
* The CNY, EUD and JPY peg the USD and follow it down… relative to what? CBs are very sensitive to local un-employment.
* US corporations abroad continue to repatriate healthy profits, reducing the CA deficit… They’ve been doing an outstanding job in this regard as of late.
* Foreign countries continue to buy US bonds because they feel the US is a safe place; especially if the above two items are progressing favorably…
…It could be awhile…
The US worker will continue to take pain from foreign competitive wages…
Well if you think that the expectaions hypothesis is wrong simply take a position in futures or notes and make yourself some money. If this time it is different put your money where your mouth is.
Has anyone come up with a rational explanation as to why the FedRes has stopped publishing M-3 reports?
That’s quite an anomoly, no?
Why then, would we think that something as “conventional” as the “expectations hypothesis” would divulge the answers we’re looking for?
Mark, the explanation for why the Fed discontinued publication of M3 is (1) it cost resources for the Fed and private sector to collect these statistics, (2) the magnitude M3 is not controlled by the Fed, and (3) the magnitude M3 is of limited significance for the U.S. economy. See the discussion here
or at Macroblog.
It seems inevitable that at some point that the US $ will fall significantly & long-term US interest rates will rise in proportion.
I though it seemed “inevitable” in December 1994…
Small Investor Chronicles
Hi,
Is it possible that the sinusoidal yield curve is simply noise amplified by the small basis point range and equality of short-term and long-term rates? From high to low, the range of yields is only 25 basis points (6mo & 5yr). If we were to increase the x-scale range on the chart to 0-10% this might look more like a flat line. Additionally, when the yield curve is steep in either direction, it is rare for such a sinusoidal chart to emerge, if anything it is usually a convex or concave arc. Thoughts?
Bond Yield Curves
I’ve never understood how to interpret the yield curve. This explanation helps. I’ve still got a way to go. By the way, I only recently discovered this weblog, and it looks like a pretty good one if your interested in…
This is my last attempt at explaining the negative yield curve:
I insist, collateral is important.
I see 2 cases of negative sloping curves;
* The normal & ugly, which I’ve explained, where a negative sloping curve augurs a downturn; mostly, because banks become increasingly unwilling to lend in the riskier short term –or poorly collateralized end.
* The Bernanke glut, where the concentration of money in the low wage and oil exporting countries, aggravated by pegged exchange rates, allows exceptionally large pools of money to look for safe investments…
Investments, which have to be made abroad, because local investment is saturated and to avoid raising the exchange rate, which would make local resources (sensitive wages to unemployment mostly) less competitive…
Evidently, these funds will flow to CA deficit countries where these funds are needed and will get a better return… So, most of them end buying bonds in the US to counter the huge US deficits.
And, long-term bonds are preferred because they are safer; they have better collateral than short-term bonds. Hence, the lower long term rates.
On the other end, the Fed is raising the Fed rates to reign in excess liquidity. Hence, the higher short term rates.
Voila!
I guess it’s important to underscore that the former case is a bad omen, but the latter has possibilities…
“And, long-term bonds are preferred because they are safer; they have better collateral than short-term bonds. Hence, the lower long term rates.”
To invest in long term Trasury bonds versus short term higher yielding Trasuries would still be a… conundrum; unless…
On Wright’s two models, in particular Model B (which includes the level of the nominal Fed Funds rate as a variable, and on which Bernanke seems to place considerable weight):
Much higher debt levels today make the lower risk of recession as predicted by Model B questionable. I think that the model, which includes the level of nominal interest rates, predicts a lower risk of recession because of past periods of low nominal fed funds rates, which are different from today’s. Over the sampling period previous instances of low nominal interest rates (1960s, pre-1973 1970s) were associated with much lower consumer debt (mortgage and consumer credit) levels. Consequently a low nominal rate would lead to strong deband for loans, reducing the risk of recession. Now individual debt levels have risen to the extent that the consumer debt service burden is higher than it was in the early 1980s when nominal rates were much higher. One cause of this is financial deregulation/innovation which has allowed indivuals to borrow much more heavily, in particular using short-term or adjustable rates. Thus a persistently low Fed Funds rate post-2000 has resulted in a much larger build-up of debt than would have been the case in the 1960s-early-1970s. This serves to weaken the effect of a low nominal Fed Funds rate.
Last attempt, I promise…
If a foreign CB wishes to vanish USDs in thin air, in order to avoid raising their currency’s value, then the longer the term of the USD bonds the better…
This lender does not wish to get paid back soon its principal + interest; it would only aggravate –with interests added– his currency objective; hence, he’s willing to forfeit the higher short term Treasury interest.
The PBoC would be a good example.
JDH,
Thanks for the point-outs. A comment on MacroBlog was asking if “repos”, once found w/in M3, were within the purview of Fed “policy-making decisions”. If this were so, would it not founder part of the explanation for the discontinuance of the publishing of the M3 series?
PLEASE DISCUSS BOND YIELD CURVE FOR THREE MONTHS
That will be the topic for my next post, Francis.