The Congressional Budget Office released its update on the budget outlook today. What’s the message behind the message?
Let’s first place matters in context. From the White House website (accessed 8/17/06):
Restraining Spending and Cutting the Deficit
Through continued pro-growth economic policies and spending restraint, the Budget keeps us on track to meet the President’s goal of cutting the deficit in half by 2009. The Budget:
- Again holds the growth of overall discretionary spending below inflation and again proposes to reduce non-security discretionary spending below the previous year’s level.
Terminates or reduces 141 programs that are not getting results or not fulfilling essential priorities, for a proposed savings of $14.7 billion, building on last year’s success in which savings of $6.5 billion were achieved in 89 of the President’s proposals.
Requests that Congress give the President a Constitutional line-item veto. All savings from the line-item veto would be used for deficit reduction.
- Projects the deficit will decline from its projected 2004 peak of 4.5 percent of GDP ($521 billion) down to 1.4 percent ($208 billion) in 2009, more than in half and well below the 40-year historical average deficit of 2.3 percent.
And indeed the CBO report presents this “fan diagram” showing probability distributions for the future evolution of the budget surplus, as a percentage of GDP. There is a high probability of achieving budget balance in the out years, under current law and a variety of other assumptions.
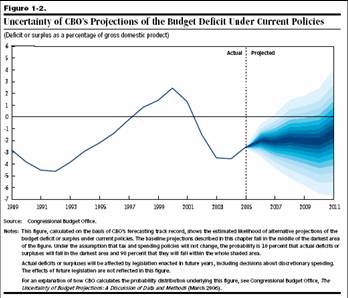
Figure 1-2 from CBO, The Budget and Economic Outlook: An Update, August 2006.
But it is important to recall that this diagram does assume current law for the policy — including tax — regime. What if, as the President wishes, the tax cuts of 2001 and 2003 are extended; and if as is likely fixes for the Alternative Minimum Tax are implemented? Then we get, expressed in billions of dollars, and as a proportion of GDP, respectively, Figures 2 and 3.
Figure 2: Federal budget balance in billions of dollars, fiscal years, baseline, and baseline adjusting for tax cut extensions and reform of AMT. Source: CBO, The Budget and Economic Outlook: An Update, August 2006. and CBO, Historical Budget Statistics, January 2006; and author’s calculations
Figure 3: Federal budget balance in billions of dollars, fiscal years, baseline, and baseline adjusting for tax cut extensions and reform of AMT, all as percent of nominal GDP. Source: CBO, The Budget and Economic Outlook: An Update, August 2006. and CBO, Historical Budget Statistics, January 2006; and author’s calculations
Note: I have not included additional outlays for extending other expiring tax provisions, laid out in Table 1-8 of the CBO report. And given recent events in Iraq, perhaps we shouldn’t bet on a build-down in Iraq theater of operations expenditures, which I discussed here.
So the answer to the second question I posed is, “deficits as far as the eye can see”. The answer to the first question is a resounding “no”.
[late addition: 3:05pm Pacific]
Here are the corresponding trajectories for Federal debt held by the public, under the CBO baseline (red), and assuming extension of the 2001 and 2003 tax cuts and reform of AMT (green).

Figure 4: Federal debt held by the public, end of fiscal years, CBO baseline (red), and baseline adjusting for tax cut extensions and reform of AMT (green), all as percent of nominal GDP. Source: CBO, The Budget and Economic Outlook: An Update, August 2006. and CBO, Historical Budget Statistics, January 2006; and author’s calculations
Technorati Tags: budget deficits,
fiscal policy, and
tax cuts
This document is crap. All the graphs are as percents of GDP. They say they do this because it is “more important” than the absolute number, but I think they do it more for political reasons.
Since much of our debt is held by foreigners. Maybe they ought to show the debt/exports ratio. We aren’t going to pay with GDP, we’re going to pay with exports.
Like I said. This document is crap. It is sad that I cannot say that I trust any document put out be the government. I believe the raw numbers they put out (BLS, census etc.) but I completely ignore any and all analysis.
A deficit of 2.5% of GDP in perpetuity doesn’t strike me as such a terrible thing. But this only goes out to 2015. After that, I bet Medicare starts to blow up.
vorpal: Well, that’s why I presented both graphs — you can make the normalization you feel most appropriate. But if you ignore all analysis, you must be spending a lot of time re-inventing the wheel.
knzn: 2.5 ppts of GDP is not so bad, but remember the CBO baseline assumes discretionary spending grows at the rate of inflation, while many components of the budget have been growing faster than that rate. If you look to Table 1-8 in the CBO document, you will see that if discretionary spending grows at a rate equal to that of nominal GDP, then the FY2015 budget balance to GDP will be 233 billion lower (primary), and 50 billion lower due to higher debt service. That’s another 1.44 percentage points of GDP.
CBO numbers are notoriously inaccurate because they use static analysis. The budget deficit is declining because of increased business activity. If the FED is successful in its war against growth we will see higher budget deficits regardless of what the COB graphs indicate.
I think the big story is the gap between the General Fund deficit and the increase in the National Debt.
There are at least three methods of presenting the deficit; the first is the “Unified Budget” (as reported by CBO) that includes the annual surplus from Social Security Insurance (and the miniscule net cash flow from the Postal Service) in the total. The second is the “General Fund Budget” or “on-budget” (required by law to be the budget reported) that excludes the SS Insurance surplus, but includes surpluses from Military Retirement, Federal Employee Retirement and many other smaller trust funds. The third approach (my favorite) is to use the annual increase in the National Debt as the annual deficit.
Usually the gap between the General Fund deficit and the increase in the National Debt is fairly small. Not this year. The CBO is projecting a General Fund deficit of $437 Billion this year; the increase in the National Debt will be close to $600 Billion.
That is by far the largest gap in history between those two measures. And this has nothing to do with Social Security (that is the difference between the Unified and General Budgets).
Last year the General Fund deficit was $493 Billion and the increase in the National Debt was $547 Billion – a gap of $54 Billion in non-SS off-budget expenditures.
This year the gap is around $160 Billion. Perhaps a little Enron style creative accounting?
Best Wishes.
I wasn’t talking about your analysis menzie. I was talking about the cbo document. just to clarify.
vorpal: Thanks for the vote of confidence. I did think (hope?) you were referring to the CBO analysis. I do think there are many agencies within the US Government that do good analysis. CBO, as an independent arm of the Congress, is in my view trustworthy. I have at various times also thought that analysis coming out of CEA and Treasury was also quite good. Being able to rely upon their writings saves me a lot of time doing calculations when, for instance, I don’t have a CGE model loaded onto my computer.
Calculated Risk: Interesting point. In the projection years, the change in the debt and the budget balance do match up pretty closely, while they don’t fit so well in the historical data. I don’t have an explanation, and one would probably have to dig into the guts of the data definitions to find out why. Valuation effects might be one reason, but that’s a conjecture.
Dick: You might wish to consult this document, entitled CBO’s Economic Forecasting Record (October 2005). For whether the “misses” in the budget projections are due to the failure to take into account feedback effects, I refer you to this post on dynamic scoring. You may very well be right that CBO will mis-project the deficits badly in the next few years, but I would suspect that will have more to do with the deviation of the economy from forecast and projection, and revisions to current law (things like Katrina-related expenditures, operations in the Iraqi theater, etc).
KNZN,
Whether or not 2.5% is a sustainable deficit sort of depends upon the real interest rate relative to the real GDP growth rate. The primary deficit (i.e., deficit less interest costs) cannot be perpetually rolled over if the real interest rate is greater than the GDP growth rate. If the deficit leads to significant crowding out, the interest rates will increase and the investment component of GDP growth will suffer. That could be an unsustainable position.
When the National Debt grows by $547 billion in the 4th year of a recovery–a recovery nearing its end–and the unfunded promises of SS & Medicare are set to explode in 3 or 4 years, it strikes me that some of you are mighty optimistic.
Menzie,
Thanks for the link to the CBO accuracy. I will look at it more closely.
From my initial review it appears that in periods when conditions are relatively stable the CBO misses forecasts by about 5% but in periods of volitility they miss by more than 10%.
Just to note Administrations prior to the Bush administration used static analysis. Bush mandated both static and dynamic analysis. So comparing CBO to Administration is comparing virtually the same analysis. I also question the “Blue Chip” forecasts for much the same reason. The major forecasting firms are often more concerned with matching CBO than actual because congress makes decisions based on the CBO numbers.
But I will look more deeply at the numbers.
Menzi,
I appreciate your review of dynamic scoring. I am new here so I did not see this. It is a good description of the situation. I am somewhat concerned by the models that the Bush Administration used and I am also concerned, as you mentioned, by the political influence. Bush in his mandate for dynamic scoring did include political considerations. But without dynamic scoring accurate numbers are virtually impossible.
Just a note to clarify some inaccuracies in the postings here.
With respect to taxes, economists at CBO develop the budget baseline. The economists at the Joint Committee on Taxation (JCT) develop revenue estimates – changes to the baseline – with respect to tax legislation.
Discussions of static and dynamic scoring (they prefer macroeconomic analysis over ‘dynamic’ by the way, as the ‘static’ analysis includes micro-level behavioral response) and CBO are mischaracterized. JCT is responsible for such analysis.
CBO then incorporates the Joint Tax revenue estimate into the baseline for successive years.
CBO gets into the changing-GDP and revenue game by examining the business cycle effects of GDP upon revenue collected. In general, they do not examine the effects tax policy have on receipts. They report the estimates JCT produces.
Macroeconomic analysis improves the accuracy, to be sure, but Joint Tax, CBO and Treasury (OTA) do a good job at a very difficult task.
RD: Thanks for your clarification. Let me quote the exact text from the Preface to the Update:
From my observations, I would say the JCT-CBO process seems interactive, rather than one-way. But as you say, JCT does develop revenue estimates, as indicated in Section B here. A brief discussion of incorporating behavioral responses is in Section D, and a longer discussion in this JCT document. Section I.C of this document also notes that JCT, CBO and OTA jointly estimate revenue “offsets”.
Notice this from the JOINT COMMITTEE REVENUE ESTIMATION PROCESS
In providing conventional estimates, the Joint Committee staff assumes that a proposal will not change total income and therefore holds Gross National Product (“GNP”) fixed. The use of fixed economic assumptions does not prevent the Joint Committee staff from taking into account possible shifts in economic activity across sectors or markets and/or changes in the timing of such activity in response to the proposed tax change, so long as GNP remains unaffected.
I believe that most recognize that there are many fiscal policiy changes, especially tax policy, that will cause a change in GNP. Also the FED attacks on the economy will distort GNP and lead to inaccurate actuals compared to forecast.
To add to 2slugbaits comment, at a deficit of D, real interest rates on government debt of R, and real GDP growth of G, the Debt/GDP ratio will stabilize at:
Debt/GDP = D / (G – R)
For a Deficit of 2.5%, using an assumption of real growth of 3.5% and current real interest rates which are around 2.25%, you get a Debt/GDP ratio of 200%, which I don’t think is sustainable. Aside from crowding out effects, I think investors would demand higher real rates for such an indebted government, even in the US.