There was a lot of discussion surrounding the BLS’s benchmark revision. Dave Altig at Macroblog has an excellent review, while Ritholz at Big Picture is perturbed about the magnitude of the data revision. Without claiming to have greater insights into why the revision is so large, I do think a look at the context would be useful.
First, note that while the 2006 preliminary benchmark revision, at 0.6 percent, is unprecedented in size, 0.4 percent revisions have occurred twice before in the 11 years revisions have occurred.
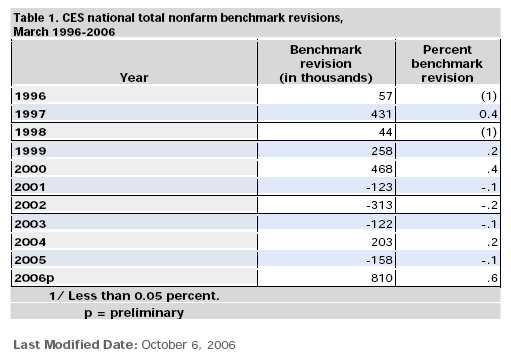
Table 1. CES national total nonfarm benchmark revisions,
March 1996-2006
Second, as has been remarked elsewhere, the benchmark revision moves the establishment series closer to the “adjusted” household series, and so potentially solves one puzzle. But recall that this is a preliminary adjustment. We’ll have to wait and see if indeed the 810,000 figure sticks. (This powerpoint presentation by Steven Braun notes some of the reasons why the establishment and the household measures can go astray, and makes an observation on the firm life/death ratio issue.)
A graph of the data shows how the revision affects overall trends as measured by the two series. In Figure 1, the actual October payroll employment series (blue), the BLS’s “research” adjusted household series (made to mimic the establishment series, see here) in green are shown. In addition, I have pro-rated the April 2005-March 2006 establishment figures to incorporate the 810,000 additional jobs implied in the preliminary benchmark. I assume the payroll employment series remains 0.6 percent higher than in the official series. This “adjusted” series is red.
Figure 1.Payroll employment (blue), adjusted payroll employment (red) and “adjusted” Household employment series (green). Sources: FRED II, BLS, NBER, and author’s calculations.
Third, we come to perspective. I thought it would be useful to see whether the revision, against a backdrop of 136 million employees, changes one’s view regarding the trends in employment growth during this expansion vis a vis the previous one.
Figure 2.Official payroll employment-current expansion (blue), adjusted payroll employment-current expansion (red) and official payroll employment series-previous expansion (green). Sources: FRED II, BLS, NBER, and author’s calculations.
The answer is no. While large in absolute number, the revision does not change the fact that employment growth has been remarkably low in this expansion.
Finally, if my assumptions are not far off the mark, then the upward revision in the employment growth up to March 2006 merely accentuates the deceleration in employment growth in recent months.
Figure 3.Month-on-month annualized (log) percentage change in official payroll employment-current expansion (blue), adjusted payroll employment-current expansion (red) and official payroll employment series-previous expansion (green). Sources: FRED II, BLS, and author’s calculations.
The “adjusted” household series is still exhibiting strong, and accelerating, growth. Which one we should pay attention to has been a source of vigorous debate here and here. While Brookings’ George Perry (Brookings Papers on Economic Activity 2005(2)[abstract]) argues for equal weighting on the household and establishment series, while in his comments William Wascher (Deputy Associate Director, Division of Research and Statistics at the Fed), demurs, and argues for continued reliance on the establishment series.
Technorati Tags: payroll employment,
civilian employment,benchmark
Remember, these 2 surveys measure surprisingly different things. The Establishment Survey specifically looks at employees as reflected in payroll taxes;
The Household survey, on the other hand, measures workers the NFP specifically does not:
– Agriculture and related employment;
– Uncompensated Workers;
– Part Time Workers;
– Unpaid Family Employees;
– Workers absent without pay from their jobs;
– Self employed, Work-at-home Contractors;
When you adjust them so they are measuring the same thing, the aberrations all go away.
Is it a curiosity or a coincidence that this news is announced near election time?
So if they revise employment up, do they revise productivity down? One might think there would be a least an indirect connection.
It just seems to me that those of us looking for jobs can’t find them and the only jobs created seem to be the ones the government makes up.
I think it’s obvious to many, this is pandering at it’s absolute worst. By the time these numbers are supposed to be published and made official, they are going to revise them DOWN.
Oh and that productivity going down would be true since we are adding to the pool of workers and hence productivity didnt increase too, so we must divide it among a larger pool.
The average unemployment rate for 1991-2000 was 5.6%. The unemployment rate for 2001-2005 was 5.4%. Year to date through September 2006 the unemplyment rate is running at 4.7%.
Is it easier to create jobs during a period of high unemployment or low unemployment?
Oh, great. Now we have two rotten series. The news that the establishments survey is recently worse than normal offers little reason to believe the household series has gotten any better.
Barry Ritholtz: Yes, the establishment and official household series are very different. The “research” series adjusted to mimic the establishment series, reported in the post, is much closer in behavior to the establishment series. But they did diverge at the 2000-01 peak, and in the last year.
Joseph: With employment up, does measured productivity go down? Good question. From my reading of the employment cost index notes, that is not affected directly. But employment cost and output measures such as the ones that have been the staple of discussion — output per hour in nonfarm business sector and real compensation per hour in nonfarm business sector — I believe are affected, as far as I can tell from this technical note, since the hours data are from the CES and CPS while output and cost figures are from BEA. I.e., Tate423 is right on his/her prediction of downwardly-revised productivity estimates.
skoobz and Tate423: I don’t think the statistical agencies have yet been dismantled. The annual benchmark is regularly scheduled.
kharris: I agree that it would be preferable to have better measured series. If the Administration would properly fund the statistical agencies, instead of trying to cut funding (see examples here and here).
Dick: Since the two are endogenous variables, I can’t figure out how to answer the question you pose.
Menzie,
How about this? If the unemployment rate is 100% will it be easier to create jobs than if the unemployment rate is zero %?
Dick: Holding all else constant, it would be more difficult at 100%. But of course, not all else is held constant. Most importantly, it would depend on the elasticity of the participation rate with respect to other factors, including dis-incentives to work, and the wage rate (in real, CPI deflated terms) relative to the reservation wage.
“The average unemployment rate for 1991-2000 was 5.6%. The unemployment rate for 2001-2005 was 5.4%. ”
Any idea what the participation rate is. Do you have any idea what the “real rate” of unemployment is?
me: The offical unemployment rate is a “real” unemployment rate insofar as it uses guidelines for construction. However, to the extent you want to see a series adjusted for discouraged workers, see this paper by Hotchkiss at the Atlanta Fed which provides some earlier tabulations up to beginning 2005 for an adjusted unemployment rate.
A more recent paper by Hotchkiss discusses the decline in the female participation rate.
Thanks Menzie. That was my point. Granted there are other factors. One of the biggest factors contributing to an increase in employment during the 1990s was Clinton signing welfare reform. People on the welfare rolls began to work increasing demand and production, and at the same time decreasing the cost to government while creating more taxpayers.
Jared Bernstein looks at the data in a similar fashion over at MaxSpeak.