Investigating the numbers
From the White House website, accessed on October 18, 2006:
Federal Government Succeeds In Cutting Deficit In Half Three Years Ahead of Goal
On October 11, 2006, President Bush Announced That The Deficit Has Been Cut In Half 3 Years Ahead Of His 2009 Goal And That The FY2006 Budget Deficit Was $248 Billion. The President’s pro-growth policies helped to strengthen our economy and create 6.6 million jobs in the last three years. This strong economic activity has generated historic revenue growth that has shrunk the deficit. A continued commitment to spending restraint has also contributed to deficit reduction.
The FY2006 Budget Deficit Was $248 Billion/1.9 Percent Of GDP, Down From An Original February Projection Of $423 Billion/3.2 Percent Of GDP. At this level, the deficit is 0.4 percent below the 40-year average of 2.3 percent of GDP.
This Level Surpasses By $12 Billion President Bush’s Original Goal Of Cutting The Deficit In Half By FY2009 From Its FY2004 Projected Peak Of $521 Billion, Or 4.5 Percent Of GDP.
Pro-Growth Policies Are Fueling A Robust Economy And Increasing Revenues
Tax Relief Is Spurring Economic Growth. Working with Congress, the President doubled the child tax credit, reduced the marriage penalty, cut taxes on capital gains and dividends, and reduced income taxes for every American paying them. Tax relief brought an extra $2,500 to 44 million American families with children. The President’s tax relief continues to help our economy grow faster than any other major developed country. Sustaining this economic momentum requires making these tax cuts permanent.
A Strong Economy Has Led To Historic Revenue Growth. The President’s pro-growth policies have helped fuel economic activity that has produced two years of record revenue growth. FY2005 revenues were 14.5 percent higher than the previous year and at $2.153 trillion were the largest in history. This year’s revenues of $2.407 trillion increased 11.8 percent from FY2005 and September 15th’s $71.8 billion in corporate receipts were an all-time high.
Spending Restraint Works
The President Has Restrained Spending. Every year that the President has been in office, he has reduced the growth of non-security discretionary spending. Additionally, in FY2006, the President succeeded in holding the growth in base discretionary funding to less than the rate of inflation.
:
:
Let’s skip the employment growth issue which has been dealt with previously, to focus on the fiscal claims. While the actual budget surplus is of interest, from a macroeconomic perspective, the full-employment, or “cyclically-adjusted” budget surplus is what is of key interest. The CBO observes that this series, and the “standardized” budget surplus (which addresses timing issues), exhibit much less marked improvement, as shown in Figure 1.
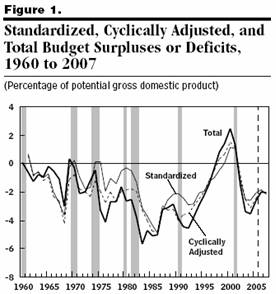
Figure 1 from CBO, “The Cyclically Adjusted and Standardized
Budget Measures: An Update,” October 2006.
While the actual budget deficit is estimated to have shrunk from 3.5 percentage points (ppts) of GDP in Fiscal Year 2004 to 2.0 ppts in FY2006, the standardized budget deficit shrank by only 0.8 ppts, from 2.6 to 1.8 ppts. Note that all three series start going south again in FY2007…
The White House speaks of the current revenues to GDP ratio glowingly (for a critique, see this post). The CBO estimates that the standardized revenues to GDP ratio in FY2006 at 17.7 ppts. In comparison, FY2000 and FY2001 standardized revenues were 19.3 and 18.9 ppts, respectively. Interestingly, standardized revenues [as share of GDP] are projected to decline in FY2008FY2007 (see Table A-4).
The White House also touts the accomplishments of restraint in non-security discretionary spending growth. Well, this is a bit easier when inflation is lower than in the past decade. But I thought it would be useful to plot total (security and non-security related) standardized discretionary spending in real (personal consumption expenditure deflator) terms. As is clear from Figure 1, this series has been, and is still, growing rapidly (blue line).
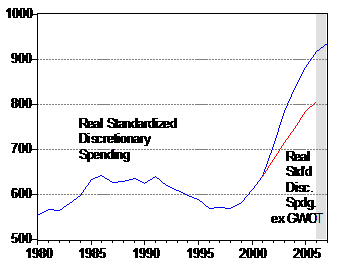
Figure 2: Real standardized discretionary spending (blue), and spending ex. Global War on Terror expenditures (red), by fiscal year, in FY2000 billions of dollars (using PCE). Sources: CBO, “The Cyclically Adjusted and Standardized
Budget Measures: An Update,” October 2006,
Table C-1, “CBO’s Year-by-Year Forecast and Projections for Calendar Years 2006 to 2016,” in The Budget and Economic Outlook: An Update (August 2006), and A. Belasco, “The Cost of Iraq, Afghanistan, and Other Global War on Terror Operations Since 9/11,” Report to Congress RL33110 (Congressional Research Service, September 22, 2006).
What if one excludes Global War on Terror (GWOT) expenditures? Then one still sees rapid expenditure growth (red line). To the extent that one believes the Iraqi adventure was a war of choice, then the blue line is more representative of “discretionary” expenditures.
Finally, one thing not mentioned is the legacy of the massive deficits run over the past five years, namely interest payments on the accumulated debt. Figure 3 shows standardized government interest payments, and the acceleration in payments in 2006.
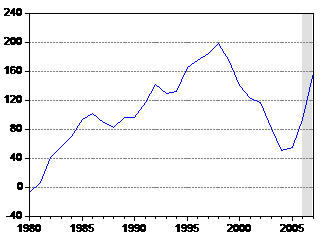
Figure 3: Standardized interest payments, by fiscal years. Sources: CBO, “The Cyclically Adjusted and Standardized
Budget Measures: An Update,” October 2006.
[Late Addition – 8:30am Pacific, 20 October]
In response to Grzesiek’s criticism that I’d been selective in choice of reference dates, I add in a picture depicting the entire sad story of standardized Federal tax revenues to GDP ratio over the years of the Bush Administration, and compare against the average over the 1980-2006 period. The recent figures that are the subject of so much jubilation do not look overly spectacular in this context.
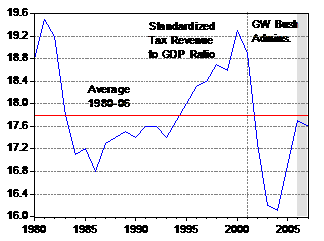
Figure 4: Standardized Federal tax revenue, by fiscal years. Source: CBO, “The Cyclically Adjusted and Standardized
Budget Measures: An Update,” October 2006.
Technorati Tags: tax revenue, budget deficits
fiscal policy, and
full employment budget surplus
Menzie,
Federal revenue increases are slowing. Why is it that they increased beyond most forecasts over the past couple of years? Isn’t it better to answer this question then support doing the same things again than to simply project that the whole thing is falling apart?
I have heard repeatedly that Congress ran a surplus during the Clinton Administration, and that Congress took us back into the red during the present administration.
From what I learned in macro as an undergrad, if the government runs a surplus, then the national debt decreases. The Treasury Dept gives the national debt on an anuual basis.
From this, it can be seen that the last time the national debt decreased was 1960. From this, I conclude that the government has run a deficit every year since then.
Please explain to me the basis of these claims that Congress ran a surplus during the Clinton Administration.
Regards,
Bruce
You write:
——-
Interestingly, standardized revenues are projected to decline in FY2008 (see Table A-4).
——-
First, I think you meant 2007. However, revenues will increase in nominal terms from $2.4 to $2.5 trillion. There is a small decline in revenues as a percentage of GDP because CBO forecasts that potential GDP will grow faster than tax revenues. Given that CBO has tpyically underforecasted economic growth, this may be a legitimate concern.
The increase in gov’t spending and debt financing needs is indeed worrying, particularly given rising interest rates.
Dick: Please see my previous post on this matter. I didn’t say everything was falling apart. I’m just injecting a little perspective, and departing from Pollyana-land.
Bruce McCullough: Government accounting is not exactly the same as GAAP accounting. In any case, see the time series plot of publically held debt (i.e., not including intra-governmental holdings), at the St. Louis Fed’s website, at this entry.
RD: Thanks much for the clarifications and corrections.
As is clear from Figure 1, this series has been, and is still, growing rapidly (blue line).
Yeah. Though I actually saw a complaint from someone who wanted more spending, saying that it wasn’t growing enough per head. Not sure I agree with that, but per capita spending (and taxation) adjustments provide interesting information just as inflation-adjusted and percentage of GDP numbers do.
Bruce,
A federal surplus is when federal revenue in any year exceeds federal spending. This did happen during the Clinton administration because of unexpectedly high federal revenue receipts.
Bruce,
This site should help you.
“In comparison, FY2000 and FY2001 standardized revenues were 19.3 and 18.9 ppts, respectively.”
Yep, by an over hyped stock market built on irrational exuberance.
Way to be selective in presenting your argument professor
Grzesiek: I’d say I was rather kind in my comparison. I could, with equal plausibility, say that recent standardized tax revenues are artificially estimated by the (now ending) frothiness in the housing market (think capital gains, construction spending, etc.); or perhaps the unnaturally high corporate profit rates. Or maybe the odd way in which stock options have been granted in recent years. But, I’ll just present the entire time series (see addition to the post), so that you can assess the true mediocrity of recent (cyclically adjusted and standardized) tax revenue-to-GDP behavior. [By the way, these data were all easily accessible with one click on the CBO document.]
The deficit ‘declined’ in 90’s because social security funds from the payroll tax were ‘invested’ in us government debt.
Why is it a surprise to see that tax revenue-to-GDP is down? Bush and congress cut marginal rates, so we should see revenue-to-GDP decline barring any structural change in income distribution.
I think the argument from the Bush crowd has always been that the cuts in marginal income tax rates and in capital gains tax rates spurred economic growth to be greater than what would have been. Larger than expected GDP can equal larger than expected tax revenues (and more overall revenue ajusted for inflation) while the revenue-to-GDP ration declines.
Mike-
Bingo!
Mike and Rich Berger: Regarding the scenario you outline, you really should read this post.
Prof,
The key here is to reduce government spending and to keep the cut taxes on capital gains and dividends, and reduced income taxes for every American paying them.
Government budget deficits are financed in part by selling government securities to the citizens, who pay for the securities out of their savings.
If the government had not been running at a deficit (assuming this is the only reason for selling government securities) and had not needed to sell these securities, folks would have used most of the savings to buy corporate securities instead of government securities.
The investment of savings in corporate securities would (hopefully) be used to purchase capital goods and to pay wages.
And as we all know professor, consumer spending accounts for more than two thirds of GDP.
Future tax reciepts to the government will yield nothing; government has a horrible track record on spending money efficiently.
Grzesiek: Well, I’m sure you’re right…although isn’t this post going on a system called the Internet, which was a DARPA (Defense Advanced Research Projects Agency) investment? Oh, and I seem to recall something about USDA agricultural research stations being an early R&D system that propelled U.S. agricultural productivity far ahead of other countries. And I suppose I must admit that military investment projects like the F-22 are less than completely efficient, but I think those, and other expenditures in say the B-2, might be construed as useful endeavors, relative to some private sector ventures. Think Enron and backdated stock options. So, without completely disagreeing with your assertion about efficiency, that really isn’t the question. Rather it’s the marginal social benefit versus marginal social cost of a dollar allocated in the private versus public sector.