The Administration has been lauding the acceleration in compensation growth. Newly revised figures indicate that the rejoicing was premature, as Q2 real compensation growth was revised downward.
As noted by Haver:
“Compensation per hour, however, was revised sharply with the 3Q estimate taken down one percentage point to 2.6% growth. Combined with a huge downward revision to 2Q growth to -1.2% from +6.6% (not a typo) it lowered the y/y change to 4.3% which is on a par with the growth during the last several years.”
The new data paints a very different picture than that displayed three monthsago. Now it is unclear that CEA Chairman Lazear could repeat what he said back in September:
“…2006 has seen significant increases in nominal wages above the levels of past years. Indeed, the nominal wage growth associated with increases in productivity has virtually offset the increase in prices associated with the unanticipated and extraordinary energy cost increases that have occurred since June of 2005. In the first two quarters of 2006, real hourly compensation grew more than 6 percent at an annual rate. If this trend continues, 2006 will be a period during which real wage gains begin to catch up with earlier gains in productivity, despite large price hikes in the energy sector.”
Figure 1 shows the updated picture.
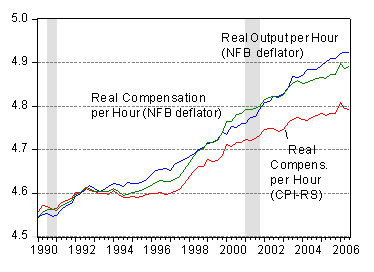
Figure 1: Log output per hour in the nonfarm business sector (blue) and real compensation per hour in the nonfarm business sector deflated using NFB deflator (green), using CPI-U-RS to end-2005, and CPI-U thereafter, as reported by BLS (red), 1992=100. Source: BLS via FRED, and author’s calculations.
As this figure demonstrates, there is little convergence in the real output per hour and real compensation, even defined using the nonfarm business sector implicit deflator. Obviously, using the research CPI series, real compensation is even lower (and, as discussed this post, using the Employment Cost Index, which would exclude bonuses, would show yet less evidence of catch-up).
Figure 2 shows a detail of the revisions to 2006Q2 data for both compensation series. The September release indicate a closing of the gap. The December 5 release indicates that the 2006Q2 jump was just a spike.
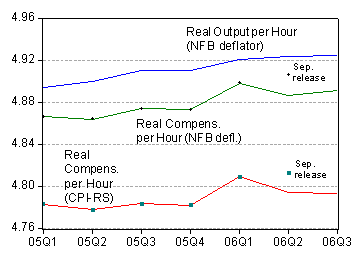
Figure 2: Log output per hour in the nonfarm business sector (blue) and real compensation per hour in the nonfarm business sector deflated using NFB deflator (green) [black circles for Sep. release], using CPI-U-RS to end-2005, and CPI-U thereafter, as reported by BLS (red) [teal boxes for Sep. release], 1992=100. Source: BLS via FRED, and author’s calculations.
By the way, if one excludes the effects of bonuses and stock options, it is likely that compensation trends would look worse. Figure 3 presents the log nominal compensation per hour, and log nominal employment cost index, both normalized to zero in 2001Q1.
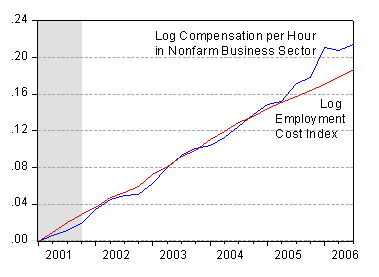
Figure 3: Log nominal compensation per hour in the nonfarm business sector (blue) and log nominal Employment Cost Index (ECI), NAICS definition, 2001Q1=0. Source: BLS via FRED, and author’s calculations.
Technorati Tags: href=”http://www.technorati.com/tags/productivity”>productivity,
compensation
James,
Thanks for posting this. I do believe that there need to be serious criticism of the method of data collection. Our government takes on more and more control of managing our economy and yet its numbers are abysmal. If private industry was presented with this type of error either the source of the error would be fired or reassigned, or the business would fail.
To the actual numbers this seem be more evidence that the FED has driven our economy down. I hate the term “soft landing” but I do believe that it is this kind of statistic that keeps making our landing harder and harder. The FED pushed us out of the airplane and they seem intent on making things worse for us on the way down.
Sorry, Minzie, thanks for posting this.
Not all of us went for that 6.6%Q2 wage increase as we went scurrying to find out exactly which sector (besides those famous Houston janitors) was responsible for this very surprising result.
Now about the correction on that number, (-)[minus]1.2%. How often do we get a negative number here? [You see pretty soon we are all behind Dick, not trusting Lucy to hold the ball.] It looks like the change that is discovered now is ascribed to an earlier period to soften the impact of the current number. Such a large correction might need an explanaton to restrain the likes of Dick ‘n me from getting a little cynical.
Last skeptical (and not yet cynical) thing: why do we exclude financials here? Is it because the secretaries at the investment banks skew the typical data? [No, is it because there is no category for ‘trader’, same as ‘heister’?] Given the increasing disparity in wealth and the increasing share of Financial companies in our economy, the ‘typical’ or non-financial report appears to be an increasingly blinkered view, no?
The non-financial GDP of Barbados must be a very short report.
calmo – Barbados at least produces rum.
Think Jersey (the original) or the Channel Islands.
I’m having a hard time keeping track of which citations are real and nominal in the first three paragraphs. I seems that you are saying that Haver’s numbers are real and that the the y/y increase of 4.3% is real. Does that mean nominal wages have increased more than 7% in the last year? That doesn’t seem possible.
NFP: Watch the Comp
Last month, we retired the Over/Under bet. The monthly and annual BLS revisions have conspired to make the initial numbers all but worthless. As an economic indicator, the monthly NFP data is wanting (Household Survey is worth even less). If we take th…
More on the wage story from Kevin Drum, Dean Baker, and yes this Angrybear. It seems the increase in nominal wages last month was very modest.
Expect all kinds of strange numbers in the automotive manufacturing territories as Ford and GM shed employees.
There is so much employment turmoil that it is hard to get a handle on data that means anything.
Does a $60,000 compensation package for leaving get figured in? What happens to median income when contract workers replace 30-year employees? And what happens to the businesses and that rely on the automobile manufacturers?
Some areas will benefit from new manufacturing facilities as the Kias and Toyotas ramp up. But it won’t be 100% replacement; lots of finished product will be imported.
Manufacturing output is dropping while the service sector is somehow staying afloat… for how long?
For many, the “real compensation” is strangely fluid. When gasoline prices increases add $100-200 per month in costs without additional benefit, then employment income isn’t keeping up. When gasoline prices drop, “real income” suddenly goes up. Sure, it isn’t measured that way, but that is the “real” effect.
Just seems like too much variability to talk about average compensation and have it be meaningful. The patient is much healthier except for the tumor.
Dick and Calmo: Certainly, one would hope for better tracking of the economy by our statistical agencies. I have two observations. First, around cyclical turning points (which is where I think we are), it is particularly difficult to measure economic activity. Second, rather than abandoning policymaking, we can take a pro-active stance by writing to our elected representatives to support greater funding of the statistical agencies like BLS, BEA and Census. See this post for more on this point.
Joseph: In my first paragraph, real is real; in the second paragraph — the quote from Haver — compensation is nominal compensation. In the fourth paragraph which is a quote from CEA’s Lazear, real compensation is real compensation. If you look at the notes to the figures in the post, all will become clear.
Bruce Hall: I’m not certain I understand your point. Real compensation as reported (i.e., using the BLS’s research CPI) takes into account rising (and falling) gasoline prices. Regarding what is taken into account, see footnotes and technical notes to the release for a start. The latter states regarding compensation:
However, on your general point that it will be hard to track the economy with so many conflicting forces in play, I’m fully in agreement.
Dr. Chinn,
Thanks for the clarification. I wasn’t sure what specific adjustments were made to the data.
The economic situation in Michigan and perhaps some other NE manufacturing areas seems a bit chaotic with the housing market collapsing and “de-employment” looming (hard to qualify these buyouts as unemployment in the traditional sense). There just seems to be a pervading sense that the economic structure is getting very “porous”.
One wonders how long the service sectors can continue to prop up the economy when so many other negative influences are converging.
Menzie wrote:
Second, rather than abandoning policymaking, we can take a pro-active stance by writing to our elected representatives to support greater funding of the statistical agencies like BLS, BEA and Census.
Minzie,
My brother is one of the most successful grant writers for a major university so I understand the desire to have more money channeled to statistical agencies, but I have to say that money will neither correct bad data collection nor bad policy, especially when the private sector can and should do it better.
Dick: I didn’t say that more money should be funneled to universities or external contractors. I think that more money should be devoted to hiring people to collect more data on more activities (esp. services, digital economy, etc.), within the Federal government. Further, I doubt the private sector will step in if the public sector exits. What private sector entity is going to find it worthwhile to invest in collecting GDP data when there is a clear free-rider problem?
And given that there are some statistics that private entities would be loathe to share with other private entities (think natural gas inventories), I think you have a very large number of places where a market failure exists in data collection.
[Full disclosure: I have never applied for a grant from, or been employed by, either BLS, BEA or Census.]
And please Dick, it B Menzie. Assert control of those digital extremities! That faltering hand-to-eye coordination. That failing eyesight…something.
So, these kinds of corrections (+6.6 -> -1.2) do happen and presumably not just at turns and it just takes more than 1 data point to make a trend…[As if +6.6 was in keeping with numbers in the previous series, but it was sky high, no?]
I’m getting the picture. Dr Lazear is paid to be hastey here and sadly, we posters are whipped.
I don’t think I have the patience to do a good job in this area: sorta like roasting your hotdog for hours on end believing that “No, it looks crispy alright, but there could be a few bits in the center that still need to be heated up.” It is not always easy getting the dog right on time.