Another week of some wildly contradictory employment indicators.
Automatic Data Processing (ADP), which provides an advance estimate of total U.S. monthly employment growth based on the records the company maintains of a quarter-million business clients covering 14 million employees, gave many of
us a scare Wednesday when it estimated that U.S. employment fell by 40,000 jobs in December. But today the Bureau of Labor Statistics said that no, nonfarm payrolls (NFP) were up a robust 167,000 based on their survey of establishments and a whopping 303,000 based on their survey of households.
The respective estimates each have their own strengths and weaknesses. For example, ADP and NFP do not have a reliable measure of nonpayroll work or employment by new establishments, while the household survey is particularly likely to miss people who change their residence immediately after they lose their job. The reaction of many people to such disparate indicators is simply to disregard several of the measures or even to ignore all three. However, each indicator is picking up some things that the other two are missing, and I’ve argued that the best statistical approach in such settings is to combine the information from all three. I’ve been using a weighted average based on the assumption that the NFP is considerably more reliable than either of the other two, giving NFP a weight of 80% and each of the others 10%. For example, the BLS had initially claimed that NFP had risen by 132,000 in November, but the other two indicators were more optimistic, so I wrote last month that a better estimate for November was closer to 150,000. It is interesting that today’s release from BLS indeed revised their November estimate up to 154,000.
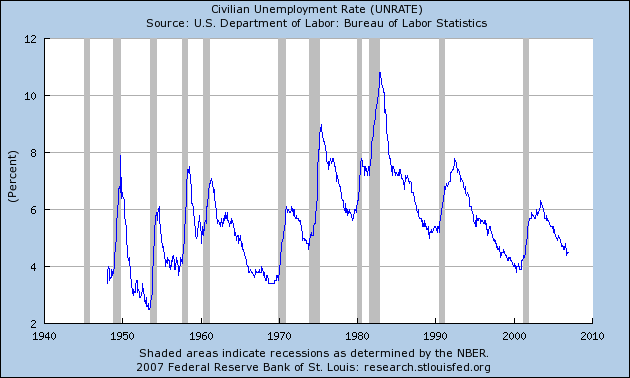
Applying that same approach to this month’s ADP, NFP, and household numbers gives an estimate for December employment growth of 160,000– given how bearish the ADP numbers were, the initial NFP estimate is likely too optimistic. However, the number could be revised quite a bit below 167,000 and still be better than many of us were expecting. In any case, job growth proved sufficient to prevent the unemployment rate from rising above its previous 4.5%. Calculated Risk notes that although construction employment has now fallen 134,000 since February, total employment growth remains strong.
Still, that initial ADP report left me wondering– what would we be saying today if the NFP and household survey had agreed that December employment fell by 40,000?
Technorati Tags: macroeconomics,
employment,
BLS,
BLS household survey
“what would we be saying today if the NFP and household survey had agreed that December employment fell by 40,000?”
An interesting question professor. Many observers tend to read way too much into one months data from one source (myself included on occasion). Using a weighted average of the three measures seems the best approach, and even then it should be taken in context with other data.
I do think the result brings the views of the bond market and the Fed closer together.
I’m hearing a lot about a short supply in skilled labor. I can testify as someone hiring in IT, that it is difficult to find qualified people who will work for what we can pay (which is still significantly above median income). Frankly, the government and security complex has sucked up all these people, as they can afford to pay them much more (it’s all deficit money anyway).
This really worries me: it seems to me we’re living in an “illusory employment” era, where government spending, self-employed or semi-self employed jobs like real estate agents, and underemployed jobs (college grads working at starbucks) are painting a false picture of a healthy labor market with lots of jobs.
..who will work for what we can pay.. rather than where the market is. Anything in short supply rises in price, and we still don’t see that. Turnover is particularly low as well, so there is little competition for workers. It is at least healthy in the sense few feel desperate to take any job.
Congratulations on your Nov. prediction of 150K and having the revised number come in right near that, now. Keep up the good work, sir.
From my experience, the NFP was to strong and will be revised CONSIDERABLY down. Much like the overly strong summer ADP report. I suspect 100,000-150,000 could be cut out of this report and much weaker wage growth. After supporting each other in November, when you see huge problems like this, always take the under. Unemployment could shoot up in January like January 2001 as well.
Employment thus is not holding up. It has begun its decline
Did you see that Gov guy shouting “boooo yaaaah!” to Mark Haines at CNBC? Made me wonder how serious we can take this, he was cheerleading so hard it looked really weird
I spoke with a technical person at DOL today, and was told that an upward revision of previously reported Establishment Survey/NFP results is going to occur with the next EMPSIT on Feb. 2. I get the impression that it might be bigger than the 810,000 upward revision that occurred in Oct. 2006, but we’ll have to see.
I think the Household Survey employment numbers are climbing quickly because “on the fence” people who can take it or leave it when it comes to working and who wait until condition are right, are finding conditions right. It may be that a lot of women, whose workforce participation rate dropped significantly since the late 1990s (esp women with very young kids) are deciding the offers to get back into the workforce are too good to refuse.
OR (this is not good), the Household numbers are moving up because a large number of newly self-employed are getting involved in doing businesses they wouldn’t be doing if they could find a job somewhere, or they are in schlocky businesses that aren’t going to succeed.
I want to see the prison population plotted against the official “unemployed” count — that’d be fun.
And when was it they invented the category of “discouraged” worker? Probably around 1983 right?
“Another week of some wildly contradictory employment indicators.”
JDH,
Can you point to or develop a better metric to accurately measure employment? Certainly, posting and reposting corrections to employment numbers does no one any good.
Aaron says:
“Frankly, the government and security complex has sucked up all these people, as they can afford to pay them much more (it’s all deficit money anyway).”
I am particularly interested in the government part of your statement.
Please cite your evidence specifically identifying:
JDH,
If 80% of your weighted avg of employment growth comes from ADP numbers that showed job losses of 40,000 for December, how do you arrive at a gain of 160,000 when you apply your 3 way weighted avg to December?
Bob, 80% of the weight goes on NFP, only 10% on ADP:
(0.8)(167) – (0.1)(40) + (0.1)(303) = 159.9
Professor,
Does your weighting hold for all the historic data?
I couldn’t resist; here’s a new commentary on the employment statistics and their reporting.
Grszesiek: in the above link is a chart showing that since 2001 Government is essentially tied for the second-highest job creation, with construction but behind health care. And I bet this count excludes government contractors.
That’s one million jobs distinctly counted, probably 2-3 times that in ostensibly “private” contracting buildup. None of this is permanent. But in the meantime, things look OK — what a lovely thing deficit spending is, no?
Rest on your laurels at your own risk.
It seems to me we’re living in an “illusory employment” era, where government spending, self-employed or semi-self employed jobs like real estate agents, and underemployed jobs (college grads working at starbucks) are painting a false picture of a healthy labor market with lots of jobs.
Well, one open question is how real or illusory do you consider jobs like “speculating via EBay” or “building up characters and goods in some MMORPG and selling them to people” as well as other self-employed jobs. On to more normal self-employed type jobs, do you consider “freelance journalist” to be inherently more illusory than working in a newsroom? I certainly know people who prefer freelancing, so I’m not sure that kind of view is fair.
Certainly I agree that those types of jobs are becoming more common.
Government is essentially tied for the second-highest job creation, with construction but behind health care. And I bet this count excludes government contractors. That’s one million jobs distinctly counted, probably 2-3 times that in ostensibly “private” contracting buildup.
Umm, but according to that chart on your page over 700,000 of that almost one million jobs were in local and state education. How much does that have to do with federal deficit spending? Somewhat with the massive increases in federal Department of Education spending, I suppose, but I’m not sure that it really supports the point you’re trying to make.
Also, lumping sectors like that doesn’t actually tell us much.
I could agree that perhaps education has too many bureaucrats and possibly even too many low-quality teachers instead of higher paid high-quality teachers, but still many people believe that additional investment in education is something that we need.
Mcmike, to evaluate this empirically I’d need to have the historical NFP series not as it’s currently reported but instead as it was initially released each month. It would be possible to put such a data set together using the database at the Federal Reserve Bank of Philadelphia, but I have not done so. I’m relying instead on the result from statistical theory that the optimal forecast is a weighted average with weights inversely proportional to the variance of the measurement error, and have simply made a subjective guess that the average squared measurement error in ADP or the household survey is 8 times as big as that in the NFP. Hopefully I’ll have a chance to put up another post on these questions as there seems to be some interest in further discussion.
Aaron: Sorry if I repeat myself from elsewhere, but as far as I can see one aspect of “tech” hiring is that employers’ current attitudes re. employment relations and the state of the job market don’t reflect on just compensation/benefit packages, but also asked skill profiles and credential level, with the understanding that somebody else has to provide the detail expertise so that you can hire the “perfect match” from the market.
The concept of building and investing in employees that stay with you has markedly declined. Workers are (again?) viewed and treated as a plentiful commodity (e.g. by defining down packages, perks, and relations from dotcom level to “industry standard”), but unfortunately that leads them to view and treat their employers just the same.
Where I am, quite a few would like to leave for something better, but with little prospect of (sustainably) “better” not just “different”, the balance of risk and expected reward is tipped in favor of inertia.
Arbitrage is a two-way road. When you want above-average talent, you have to provide above-average conditions (and that’s not just money), in the aggregate and on a sustained basis. For the time being, trust in employers and confidence in careers is gone.