I’ve been looking at real long term interest rates as proxied by nominal rates minus expected inflation. The problem of course is finding measures of expected inflation. Subtracting off the ex post rate (appropriate under the rational expectations hypothesis) can lead to misleading inferences — and is not practicable for current measures of long term rates. Using ten year constant maturity rates and the Society of Professional Forecasters 10 year horizon CPI inflation rates yields the following picture.
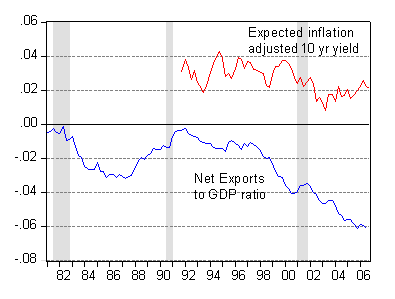
Figure 1: The Net Export to GDP ratio and the ten year constant maturity yield (end of quarter) yield minus the ten year ahead (median) expected CPI inflation rate. Source: FRED II and Philadelphia Fed.
The interesting thing is that recent periods indicate an increase in the real rate, with no apparent diminishment in the US trade deficit (as measured by the NIPA). So much for the saving glut hypothesis.
Is this finding an artifact of the measure of real interest rates used? I don’t think so. In Figure 2 I plot the above measure (green), and compare it agains the inflation indexed measures for the 10 year TIPS yield (red) and 30 year TIPS yield (blue).
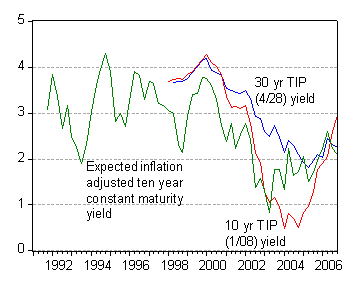
Figure 2: Ten year constant maturity yield (end of quarter) yield minus the ten year ahead (median) expected CPI inflation rate (green), 10 year TIPS yield (red) and 30 year TIPS yield (blue), in percentage points, daily averaged data. Source: FRED II and Philadelphia Fed. (revised 1/3/07)
In fact, using the 10 year TIPS yield indicates that the real yield is back to 2001 early 2002 levels (rev’d 1/3/07), building an even stronger case for a diminution of the “saving glut”.
Technorati Tags: saving glut,
real interest rate,
current account deficit,
expected inflation
Tangential point: isn’t it begging the question to compare net exports to the GDP, as the GDP counts the borrowing used to support a deficit as income/national productivity? Why not use something more reminiscent of the GNP? This would suggest the disjunct in question is even larger than illustrated above.
So it looks like a classic rising real rates due to improved investment opportunities? Implying not enough liquidity to handle the demand for money. This is interesting, as its completely the opposite of what bond market pros are saying.
Your 10 year TIP chart is incorrect; the current 10 year real yield is about 2.4%.
Zvi Wolf: St. Louis Fed reports December’s average of daily values for TIPS for 1/08 at 2.61 percent. Averaging over the three months (I only had two months data before) produces 2.955 percent. I have modified the picture accordingly.
J Huston McCulloch tracks the real yield curve at
http://www.econ.ohio-state.edu/jhm/ts/ts.html
Aaron Krowne: Not certain what you mean that borrowing is included in GDP. If you mean that GNP at least incorporates net factor payments including those on borrowed capital, then I guess GNP might be more appropriate. But the quantitative effect for now is small.
Tom Graff: I’m not certain where the higher real rates are coming from. It could also be the classic crowding out effect from large current and incipient budget deficits.
Arnold Kling: Thanks for the excellent tip!
second to arnold kling for the excellent tip: i’ve been looking for just such charts forever.
Non-monetary inflation can be stopped.
“People today use the term `inflation’ to refer to the phenomenon that is an inevitable consequence of inflation, that is the tendency of all prices and wage rates to rise.” Ludwig von Mises – “Inflation: An Unworkable Fiscal Policy”.
All prices do not rise. Only the prices of variable real value non-monetary items while many constant real value non-monetary items are not fully updated and many are not updated at all.
The second inevitable consequence of inflation is the tendency of many constant real value non-monetary items NOT to rise at all – during the Historical Cost era while some constant real value non-monetary items are not fully updated.
Inflation today has and always had a second consequence during the 700 year old Historical Cost era.
[edited for length by MDC]
FREE DOWNLOAD : You can download the book “RealValueAccounting.Com – The next step in our fundamental model of accounting.” on the Social Science Research Network (SSRN) at http://ssrn.com/abstract=946775
——————–
Nicolaas J Smith
http://www.realvalueaccounting.com/
Regarding the TIPS real yield data, the levels are correct on the ’08s but you have mislabeled the series as a 10yr. While issued as a 10yr, the ’08s are now a 1yr and are highly inversely correlated with energy prices. The current 10yr TIP, the just issued 1/17s, is around 2.5% but the old 10yr was around 2.30% just a few weeks ago – you should use a rolling 10yr series in order to get a longer history.