One of the most profound questions in economics is why are some countries rich and others poor?
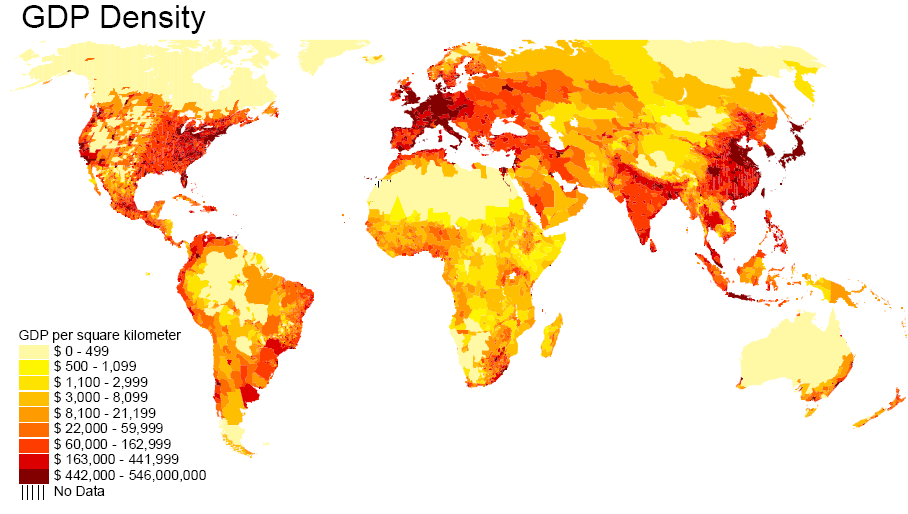
A paper by John Gallup, Jeffrey Sachs and Andrew Mellinger in the International Regional Science Review in 1999 introduced the concept of “GDP density”, calculated by multiplying GDP per capita by the number of people per square kilometer. Basically GDP density is a measure of the total amount of economic activity that takes place at different spots on our globe. I found the map they produced quite fascinating:
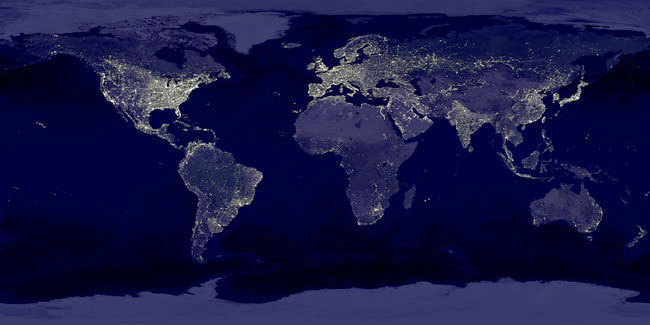
Not surprisingly, it looks a whole lot like those satellite pictures of the earth at night:
 |
Economists often try to explain differences in income across countries by factors such as the capital stock, education level, and institutions defining property rights, all of which the government could influence with appropriate policies. But when you look at pictures like these, you can’t help but be struck that there appear to be other very important and purely physical determinants of GDP. Economic activity clearly is much more intense near oceans, or, if inland, along navigable rivers where transportation by ship is feasible. Temperate climates with adequate rainfall also seem to be extremely important, perhaps for productivity of agriculture as well as for mitigating disease. When you look at just the United States, for example, no one would suggest that the big open stretches in the state of Utah imply that its governor has promoted policies that are hostile to business. Instead, the Utah desert, while one of the most beautiful spots on earth, is an inherently less suitable place for growing food or shipping products in and out. By the same principle, just looking at physical features, you’d predict that Afghanistan– a landlocked, mountainous desert– is destined to be poor, no matter what policies they adopt.
One of the lively areas of recent research in economics is trying to find empirical evidence of how much of a difference institutions can make for promoting economic activity. One could of course look at the obvious correlations between the level of economic activity and the kinds of policies and institutions in that country, but this is not very convincing. It might be, for example, that because the United States is rich in natural resources, our liberal institutions evolved as an outgrowth of that richness, rather than being the causal factor behind our wealth.
There’s an interesting new paper on this question by James Feyrer and Bruce Sacerdote of Dartmouth College. Rather than relying on the already well-analyzed data of the world’s 200 main countries, these authors developed new data on 80 ocean islands. They argued that the date at which these islands were colonized was to some degree a historical accident, and noted that the more years that island spent as a European colony, the higher its GDP is today:
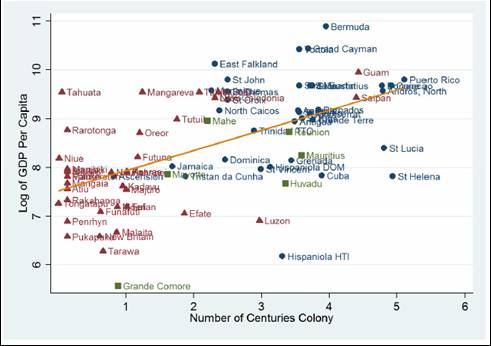 |
That correlation suggested to the authors that something about the institutions that accompanied colonization, such as laws protecting property rights and promoting capital markets, gave these islands an edge in economic development. On the other hand, another natural hypothesis is that those islands that were colonized first had the richest resources, and it is that inherently more favorable endowment that continues to help them today.
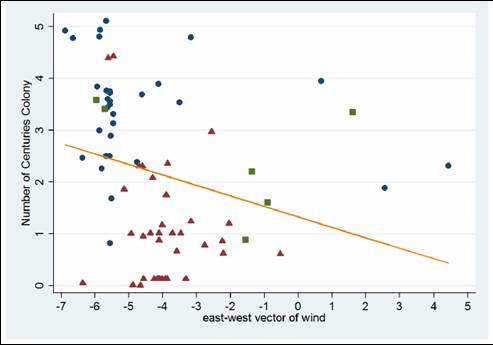
To try to resolve this fundamental ambiguity, the authors claimed to be able to explain the date of initial colonization in part by the magnitude of the prevailing winds. Their argument is that, before the 20th century, the most important determinant of whether a ship was likely to pass by or discover a given island was the strength of the east-west winds at that location. The empirical observation is that the stronger the wind, the longer the island was likely to spend as a colony:
 |
Feyrer and Sacerdote further observed that wind velocity should have been irrelevant for economic development after 1900. They therefore formed a prediction of how long a given island might have spent as a colony solely on the basis of the prevailing wind velocity, and then looked at the correlation between that prediction and the current GDP per capita. The argument is that, by using this first-stage prediction, one has isolated a statistical component of the time spent as a colony that is uncorrelated with factors that could otherwise be contributing to current GDP. They found a positive correlation, suggesting that institutions may indeed make a measurable contribution to current GDP.
Unfortunately, a critic could always object that, just as a strong wind may have helped determine when the first ship hit land, it would also have an influence on when the second ship arrived, and the third, so that it likely played a formative role in all sorts of important details such as the development of trade networks and accumulation of capital. This capital base may have provided a permanent benefit, which could perhaps be more important than anything about the current legal framework or institutions in determining GDP.
For that matter, a similar issue might account for the correlations between GDP density, ports, and climate. Perhaps the latter factors were important historically, causing physical and network capital to accumulate in certain locales, which remain prosperous today because of that capital rather than because of the ports or climate.
Physical scientists sometimes look down on economists for basing too much of our inference on guesswork and assumptions. But the truth is, most of us would love to be able to run a true controlled experiment to be able to resolve what causes what. Unfortunately, our main tool is to look at what actually happened historically in a given situation, where all kinds of variables are changing and influencing the outcome. Many of us therefore look for “natural experiments” that may have influenced such things as when an island was first colonized. But the answers, while interesting, very often fail to convincingly resolve the big debates.
Technorati Tags: income distribution,
economic geography
One of the potential explanations for GDP distribution is variations in intellectual ability, per Lynn/Vanhanan and their book IQ and the Wealth of Nations. La Griffe de Lion did a correlation between percentage of the population with IQs over 106 and GDP, and shows an even higher correlation between this and GDP than Lynn/Vanhanan get between average IQ and GDP. See
http://www.lagriffedulion.f2s.com/sft.htm and
http://www.lagriffedulion.f2s.com/sft2.htm
If this is in fact a relevant issue, then the best thing we could do is try to increase IQ globally; good nutrition can make a substantial difference in the near term and should be a top priority (and probably should be regardless).
I personally find this possibility to be a rather sad one, because if correct it says that none of our near-term options are going to be very effective, that it going to take a generation or more for things to get better, and that the long-term solution is in vivo gene therapy and/or AI augmentation, again with a 20+ year horizon.
“you’d predict that Afghanistan– a landlocked, mountainous desert– is destined to be poor, no matter what policies they adopt.”
Switzerland?
Before WWII, North Korea was the prosperous part of the peninsula.
Switzerland? A desert? Perhaps a correlation with Christianity? Buddhism?
CH is also a crossroad between several relatively close wealthy areas. It is
nowwhere as isolated as Afghanistan.
Such a MEBO (My Eyes Bulge Out!) with those world maps!
I want a time sequenced version of Ireland over the past couple of decades for tomorrow James.
I want one of Financial only GDP for the day after that and Energy only GDP following that.
How about GDP/capita to tone down India and China?
How about GDP/capita on a city scale for NYC showing the gradients on that scale…and then the change over time…and then compare that to Calcutta?
I can keep you busy with this economic geography. I feel ready to abandon you and jump ship for this new darling…thanks for the steer.
calmo: You might find this website of interest. It doesn’t provide all the maps you asked for, but does have some other useful ones.
Let me throw another idea into the mix from Yale. “A Conceptual Framework For Interpreting Recorded Human History” by Douglass North, John Wallis, and Barry Weingast is an interesting analysis of this issue from a different perspective focusing more on the structure of government as the driving force for rich and poor nations. http://www.econ.yale.edu/seminars/echist/eh05-06/wallis-061025.pdf
Sure the luck of the draw has an impact. But its how people behave that determines long term wealth trends.
It’s easy to pick out countries that changed for the better or worse with only a change in government, no change in resources at all!
rich to poor:
Cuba, Russia, India, Spain, Argentina, Brazil, Mexico, Iran
poor to rich:
Japan, South Korea, UAE, Canada, Australia, New Zealand, Bahamas, Norway, Sweden, Finland
rich to poor and back again:
Italy, France, China
Nigeria and Venezuela are overflowing with mineral wealth but their governments are broken while countries like Japan and South Korea who have very little mineral wealth have done quite well.
Kuwait started out far richer than the UAE but the Prince of Kuwait used their oil money to do stuff like building a larger than life gold statue of himself and his car while the guys in charge of the UAE invested in schools and free trade. Today the GDP of the UAE is over 6x that of Kuwait.
Strange that none of you learned economists have mentioned Max Weber and the many volumes of inconclusiive commentary on his thesis. But many of your comments go over much trodden academic ground.
To sum: It’s the culture, stupid.
And, if correct, how does that information help a single poor person?
A Gem for the World’s Econo-Cartophiles
I’ve loved maps since I was a small child, but I’ve never seen one like this before. Neat….
Has it been considered that a considerable proportion of this variation could be due to purely random changes. Early on changes in an area that may seem utterly insignificant can cause a slight increase in business in an area compared to its surroundings. The increased activity in the area attracts more commerce, and the economic activity of an area can grow purely because it is growing. The original source of the growth may be impossible to trace.
Interesting in theory, strange in content, this map.
How much should we care for what it tells us? GDP/km2 in a region is directly related to the amount of people living in that region. Hence, in the map, we have the Mezzogiorno region in the southern part of Italy, known to be a rather poor and undevelopped part of Italy, shining brightly red. Maybe this area is “rich” because many people live in it, but then they have to share that wealth. Same phenomenon with very-poor, very-densely-populated Bangladesh – it looks quite rich here.
Conclusion: maybe plain ol’ GDP/capita is not so bad after all.
JLuc, GDP density is being proposed not as a measure of how poor are the people, but instead purports to measure how poor is the land. If 10 people each produce $1,000, you could say the same amount is coming out of the area they inhabit as if 1 person produced $10,000, though obviously the people themselves are much poorer in the first example. What measure you want to look at depends on what question you want to ask. This GDP density is an unusual measure for examining an unusual question, but that’s part of why I found it interesting. Could you pack the Bangladeshis so densely in the Sahara and have them survive? I think not.
what are the r2 values on the two correlation plots? i.e. how much does the linear correlation explain the variance in data? important.. if you take line away, the linear correlation is not so apparent- in fact, terrible!
Hideki, there is more to the paper than I have described here. The statistical tests in the paper use up to 7 instruments, including for example the standard deviation of wind velocity and which ocean the island is located in. These instruments combined have an R2 of 0.624 for explaining how long the island was a colony, and an R2 of 0.444 if you tried to explain current GDP per capita directly from the instruments. The ocean in which the island is located also appeared as a separate explanatory variable, allowed to have a direct effect on GDP as well.
GDP Around the Globe
Econobrowser has an interesting write-up about how GDP is affected by geography….
Thanks for the link Menzie.
CT, this is not the Salvation Army (which we entrust with that salutary job of helping poor individuals) nor the repository of all learned economists who have the space and time to mention every scholar in the universe, but we recreational types (curious even interested, maybe even keen) take exception to being flogged by disingenuous remarks like
You know, the point is to add something to the fire, not bring your water bucket.
Gone with the wind
Interesting post by James Hamilton about the sources of the worldwide distribution of income. Claudio…
Thanks. Fascinating maps and island theory analysis.
The best kept secret in economics in this decade is the roughly 0.7 correlation between national average per capita income and national average IQ, as documented by Lynn and Vanhanen in their landmark 2002 book
Obviously, causality runs in both directions — wealthier countries can afford to do things that raise IQ, like fortifying staple foods with iron and iodine. And smarter people tend to make more money.
And, clearly, IQ can’t explain the difference between North and South Korea, but IQ is probably becoming more important as an explanatory factor around the world as fewer and fewer countries follow insane ideologies like North Korea’s. The tremendous rise in China’s per capita income, for example, probably has a lot to do with it having a slightly higher average IQ than America that was unleashed after Maoism died shortly after Mao died.
For an introduction to thinking about national average IQ, see:
http://www.vdare.com/sailer/wealth_of_nations.htm
http://www.vdare.com/sailer/lynn_and_flynn.htm
and for the data from the 2002 book, see:
http://www.isteve.com/IQ_Table.htm
wrong
welcome back to naturalism rousseauism, dear a-cultural blogger. Idealogical mireading restauring some invisible hand, forgetting all captalist history : the aera with the highest GDP are the one that colonized ressources, through “peace” (marchand) or “war” (invasion) activities. They could steal and appropriate ressources : material, energetic and human, to the point where they just act as places of ressources captation, through fiancial and / or administrative managment. Red spot in global yellow oragnge Brazil is paradigmatic : The aera is wide to be “near oceans”, “temperate climates with adequate rainfall” and so on… The aera is Brazilia, capital city, where strategical decisions, other words, captation, is,
“By the same principle, just looking at physical features, you’d predict that Afghanistan– a landlocked, mountainous desert– is destined to be poor, no matter what policies they adopt.”
wrong an dangerous
until 19th century colonization, Afghanistan is a prosperous place, devoided to local resource use, handwork ability stongly researched and east-Asia > west-Asia – Europe trade. The British – USSR – CIA taliban manipulation, and actual USA covered by UN are responsible of the low and decreasing GDP of this aera.
@Steve Sailer and other ‘IQ and Wealth of Nations’ person up thread:
Has Lynn and Vanhanen’s work been published in any credible major peer-reviewed economics journal (in the same way that Sach’s work on Geography or Rodrik and Acemoglu’s on institutions has)?
I doubt it; which is probably part of the reason why it has little credibility amongst those who study such things seriously.
The other reason, is suspect is that it’s full of holes. Along these lines:
1. Does it take in Flynn effect?
2. (re 1) Does it use instrumental variables or something similar to clarify cause and effect.
3. Does it take into account the cultural and learnt components of IQ tests.
4. Are the samples from all countries statistically significant? Do they accurately represent the population as a whole (once again I doubt it).
Fascinating, but incomplete. Variables missing are the freedom/democracy and governance indices, plus a serious look at the corruption index that has collapsed, stunted or maimed more than one country or empire. History is largely biography regardless of present day GDP.
Tim L. and Steve S., please don’t speak to IQ and its high correlation with income/national income, because Prof. Chinn doesn’t believe in it. Please present your wrists for the requisite slap.
‘The Bell Curve’ and ‘IQ and the Wealth of Nations’ make great sense to me.
Countries with secure property rights & rule of law prosper. Those without do not.
The Fraser Institute I think does an index of economic freedom. The countries in the top 20% have a percapita GDP of ~ 20 times the percapita GPP of the bottom 20%.
Dear Terence:
Thanks for the questions about “IQ and the Wealth of Nations.” May I suggest that you follow the three links I provided above, where you will find your questions answered.
Best wishes,
GDP Density Map
From Econbrowser: The distribution of world income comes this map of “GDP density”, calculated by multiplying GDP per capita by the number of people per square kilometer.
I referred to “A Conceptual Framework For Interpreting Recorded Human History” by Douglass North, John Wallis, and Barry Weingast. The implication of their concept is that central planning moves us back toward the “limited access order” as government bureaucracy picks and chooses winners. What seems to be clear is that such things as geography, natural resources, or IQ are dependent on factors that allow them to be optimized. Moving a society from a “limited access order” to an “open access order” is most important to understanding what differentiates rich and poor nations.
I think the map is useless for examining any effects within national boundaries (e.g., the GDP/area of the American west or of parts of Italy) because I’m fairly confident that the authors a mixing national GDP values with much higher-resolution population values: this means that the distribution within national boundaries is due solely to population distribution.
Another interesting website to look at for examining economic activity on a geographic, rather than a regional level, is the “g-econ” project at yale. The project attempts to do a gridded account of global economic activity which will in turn enable us to classify economic activity in terms of geographical units such as mountains, valleys, coasts, etc. rather than merely by countries, states and other political borders.
Here is the link:
http://gecon.yale.edu/
As last comment to your most wanted-oriented-error-to loose people mind, read http://www.corpwatch.org/article.php?id=1569
“The post-colonial powers were industrial countries in their late stages, when capitalism had developed further, combining industrial and finance capital into huge monopolistic conglomerates in continual search for new acquisitions, sources of cheap raw materials and labor, and markets. The third wave of globalization marked by the emergence and eventual dominance, within the most advanced industrial countries, of the information sector — the sector that produces, manipulates, processes, distributes and markets information products.”
Bit off topic: anyone notice that satellite picture is manipulated (if not fake)? How can it be night everywhere at once?
Sir Oj:
It’s a composite photograph. (The world also is not flat, so you couldn’t capture the earth in a single photograph either.)
Yeah, sure it was one of those very clear evenings without a cloud in the sky.
Dang, Oj you are good at getting us off topic.
Its clear to me from these two maps that freedom is killing the planet. The areas with the greatest freedom have the greatest energy consumption and greenhouse gas emissions. This is a trend that cannot continue indefinately without placing life on earth in serious jeapardy.
even no clouds in the sky or darkness everywhere wouldnt make the lights that bright from space. the earth picture has been greatly exaggerated.
Terence:
Yes: There are three peer-reviewed papers in the econ literature that use Lynn and Vanhanen’s IQ data. All find that IQ is an amazingly robust growth variable.
Rati Ram has a forthcoming paper in Economics Letters,
Weede and Kampf have one in Economica,
and I have one coauthored with psychologist W. Joel Schneider in the March 2006 Journal of Economic Growth. The latter runs hundreds of robustness tests on the IQ-GDP correlation. It’s safe to say that national average IQ passes quite handily. The free version is on my homepage:
http://www.siue.edu/~garjone
In this brief space, I can’t address all your questions, but suffice it to say that a lot of economists are curious about this topic. It’ll be with us for quite a while….
News of the World #19
A Four from two edition, with Marginal Revolutionaries and Econobrowsers. Marginal Revolution Did World War II end the Great Depression?, in continuation to the debate that seems to have died out, about FDR and the perverse effects of his “New De…
Garett,
Thanks for the link – I’ll look at it when I get the time. In the meantime, perhaps you could help with one question. How do you separate for cause and effect? The existence of the Flynn effect provides persuasive evidence of the fact that economic development (or something inter-related to it like education) leads to higher IQ. (If the Flynn effect had always been with us – rather than being a recent occurrence – IQs, by the time you got back to the enlightenment, would have been circa 0 – unlikely). Is there an instrumental variable you use to for this. If so I would love to hear about it (I’m sceptical I confess). I can’t imagine that you can use time offsets – for most countries there just wouldn’t be the data.
On top of this I doubt the quality of much of the third world data.
Anyhow, I will try and look at your paper when I get a chance.
Garrett,
Ok – I’ve just skimmed your abstract and introduction. You use IQ as a proxy of human capital (which presumably can be influenced by other development variables like education). Quite different from Steve Sailer’s (and IIRC Lynn and Vanhanen’s) interpretation (a heritable trait). That may negate some of my questions above. I’ll keep reading…
One of the interesting thing that this shows it the positive effect of division of labor. Contrary to Malthusian thought increased population density leads to better division of labor and thus better use of resources and thus runs counter to Malthusian effect to a large degree.
Garett Jones, I found a paper by Weede & Kampf in Kyklos, though not Economica, here – http://www.blackwell-synergy.com/links/doi/10.1111%2F1467-6435.00191
Carnival of the Capitalists – January 22, 2007
It is my pleasure to host this week’s edition of Carnival of the Capitalists as promised (or threatened) a collection of blog articles about business and economics submitted for review.
Nice post,
As a biologist I understand and sympathise with the toils of deciphering situations that can only be viewed naturally. Indeed, economics seems a few shades higher and more murky than biology with many more factors entering the arena.
Theres a gentle discussion of many of your points in Jared Diamonds book ‘Guns germs and steel’ a television documentary also if i remeber correctly.
http://www.amazon.co.uk/Guns-Germs-Steel-history-everybody/dp/0099302780/sr=8-1/qid=1169738577/ref=pd_ka_1/026-5690459-3902020?ie=UTF8&s=books
Very nice.