In his preview of the 2007 Economic Report of the President, CEA Chair Ed Lazear presented the argument that manufacturing output is still growing.
That point is depicted in Lazear’s Chart 2:
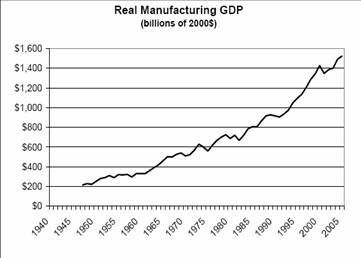
Figure 1: Chart 2 from Lazear (2006).
It would be interesting to see the real share of GDP. Unfortunately, with chain weighted quantities, it is not possible to easily calculate a meaningful “real share” measure. However, one can plot the the growth differential between real manufacturing and real GDP. Both the year-on-year and 5 year growth rates are depicted.
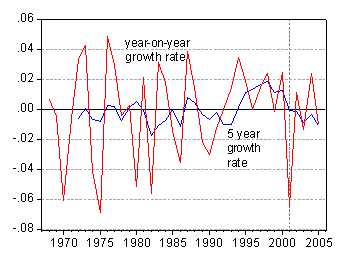
Figure 2: Manufacturing growth/GDP growth differential, year-on-year (red) and 5 year rate (blue). Source: BEA and author’s calculations.
What’s clear is that manufacturing growth has not kept pace with GDP growth over the past few years (although we do not yet know what has occurred in 2005).
Of course, the point of Lazear’s speech was to highlight the relative unimportance of manufacturing. As I’ve noted before, I believe manufacturing is important to the extent that manufactured goods are largely tradable. When the trade deficit shrinks (as it appears as it might be doing), the adjustment will have to take place on the tradables sector.
How big is the tradable sector? In Figure 3, manufacturing and the tradable share of (nominal) output are depicted. We’d be in big trouble if manufacturing goods were the only tradables — in that case only about 12% of output would be tradable. However, with the reduction in transport and telecommunications costs, many other goods — and services — are now tradable. Hence, I calculate a proxy measure of “Tradables” value added as the sum of value added in manufacturing, ex.-oil mining, agriculture, professional services, and 70% of finance and insurance. Using this proxy measure, slightly under a third of U.S. output is tradable.
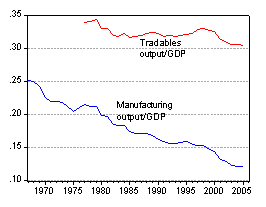
Figure 3: Manufacturing value added to GDP ratio (blue) and tradable sector value added to GDP ratio (red). Source: BEA and author’s calculations.
Here is my key point. When one expresses the trade deficit (ex.-oil) as a share of GDP, the deficit looks large, somewhat below 4% (as shown here). But the ability to pay for the trade deficit is based upon the tradable share of GDP. When this ratio is calculated, the situation looks much different (actually, a lot worse).
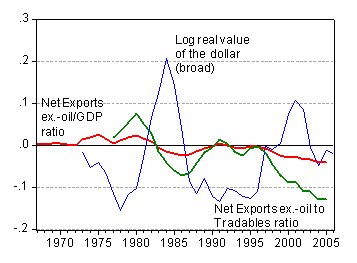
Figure 4: Net exports ex.-oil imports to GDP ratio (red) and as ratio to tradable sector value added (green), and log real value of the dollar against broad basket of currencies. Sources: BEA NIPA, BEA industry statistics, Federal Reserve Board via St. Louis Fed FRED II, and author’s calculations.
Net exports (ex.-oil) as a share of the tradables sector is about 12%. Food for thought.
Technorati Tags: trade deficits,
exchange rate,
tradables,
manufacturing
A rare instance where the log fn doesn’t take the all the bumps out (does this mean the broad basket of currencies needs to weeded/weighted according to the level of time-sensitive trade associated with that currency?).
So the trend looks like it starts in 97 with this view of the trade deficit –so not all Bushonomics.
Is this just a coincidence that the capital gains tax shelter on principal residences starts that year? We gave housing a half million dollar head start on those other business opportunities that did not receive any such favorable tax treatment?
We get housing stock at incredible prices, and our trading partners get the modern manufacturing facilities we passed up for those higher valued service jobs…writing mortgage agreements?
What did I like about Lazear’s remarks to his fellow former academic colleagues? Somehow I got the impression that everybody had this Cheshire Cat smile on their face listening to this “growing economy” talk in Chicago. It’s one thing to hear it from Bush to his choir and another to hear it from his appointed economist who addresses a slightly more informed audience. Do the rest of the economists shun the normalization of manufacturing for the chained dollar picture? [Can we hear the off-the-record conversation with his colleagues at the bar later? Nope we can’t.]
Menzie — could you spell out a bit more why you think the trade deficit ex oil is the relevant measure? it strikes me that over time, the US will have to start trading something other than debt for its imported energy …
I have a couple of questions.
If I index industrial production and real gdp at 100 in 1950 I find that in 2006 industrial production has a value of 645 and real gdp is 642.7, an insignificant difference of only 0.3 %although at the cyclical peak of 2000 the index of industrial production was 8.7% higher than real gdp.
This comparison uses the industrial production index because I can not find a series for the dollar value of industrial production that goes back very far.
But this implies that the share of industrial production in real gdp has not changed significantly over the last 50 years although on a cyclical basis IP grows relative to gdp during expansion and fall back during recessions.
My question is there something wrong with this approach that I am missing?
Second, there has been a massive shift in the growth of the components of industrial production.
Over the last 25-30 industrial production of high technology goods like computers, semis & communication has grown at about an average annual rate of some 25% while output of more traditional goods has only grown at about a 2.5% annual growth rate.
Yet, because the weights in industrial production are based on the nominal value of output the rapid price drops for high tech goods more or less offsets their more rapid growth so that the composition of industrial production has not changed much.
I understand the rational for using nominal values for weights but I am still concerned that this is creating data distortions that causes the industrial production data to be misleading.
What is your, and others, reaction to these concerns?
What percent/amount of imports are services rather than goods? This figure would probably be a more interesting estimate of service ‘tradables.’
I agree with Brad S. this is good work. I am glad that there is an economist willing to take the problem I outlined on this blog, at this link:
https://econbrowser.com/archives/2006/11/current_account_3.html
Here’s what it says:
have a bit of a problem with the practive of only comparing the trade deficit to total GDP.
Imagine that the USA didn’t produce one manufactured good. Imagine we imported every single product…every chair, every barrel of oil, every car…etc. So our entire GDP was domestic services…health, finance, gov’t etc.
By comparing the trade deficit to GDP only, that seems to imply that the above configuration of the US economy would be every bit as good as the current one where we do produce significant amount of goods. I have a hard time believing this, so it seems to me that the structure of the GDP is also very important.
The conventional wisdom seems to be to compare the trade deficit with GDP, but I believe that sort of analysis is shallow and misrepresents the true situation.
I have yet to hear one economist comment on this question. It’s almost as if they prefer not to think about it.
Posted by: vorpal
To his credit, menzie replied:
vorpal: I agree that dividing the trade balance by GDP is only one way of normalization. But it’s not clear what would be better. Dividing by tradables output, or final demand, are plausible alternatives, but each answers a slightly different question.
To which I responded:
Menzie: I think the issue is “What is the proper metric for a nations ability to pay back it’s debts?” ..
I am very glad than somebody was willing to scrutinize this issue more closely.
“When the trade deficit shrinks (as it appears as it might be doing), the adjustment will have to take place on the tradables sector.”
It will be interesting to see whether the trade gap can, in fact, narrow while GDP is growing well. There may be some slippage in timing, but the drop in the trade gap and closely related drop in inventory growth (as spencer pointed out elsewhere), are not typical for an economy growing at a 3.5% real pace. If we were just cleaning up a minor inventory overshoot, then the trade gap will widen again once inventories are back in balance.
calmo: The Fed’s broad trade weighted index allows for year-by-year variation in weights. For further discussion, see this post on real effective exchange rate indices.
I think it is by now well known that in order to calculate “real shares” using Chain weighted indices, one has to be very careful, and place the proper caveats with the presentation. Hence, expressing nominal shares — attached with some statement about trends in relative prices — is more common.
Since I wasn’t at the Chicago session, I have no idea what the response was to the “strong economy” thesis. However, as I’ve noted previously, the growth in the U.S. economy measured using real GDP in Chain-weighted constant dollars is the same in this expansion as the previous (from NBER-defined trough) even though we have used enormous amounts of fiscal and monetary stimulus.
brad setser: Excellent question. I was trying to examine that portion of the U.S. economy that involved production of goods and services, and not being driven by trends in U.S. resource depletion and energy intensity. Or, since the U.S. never exports much oil and oil products, adjustment must almost fully take place by import compression. Such is not true for other tradables (i.e., think of some manufactures currently going to domestic consumption might be reallocated to foreign.) I fully agree that other macroeconomic questions, the total trade deficit is the relevant variable. One could then normalize the total net exports variable by tradables sector value added calculated including oil production.
spencer: I am not an expert on these matters, but the Fed’s industrial production index is, as far as I know, not a value-added based measure. Rather it is a weighted average of gross output. The weights are probably not consistent with the construction of the manufacturing sector weights in the NIPA (which are in turn value added basis). I agree that looking at nominal shares might be misleading when relative price trends are changing rapidly, but I think the next best is to look at the relative growth rates of real variables, as I did in Figure 2 of the post.
vorpal: In 2006, service imports were $349.6 billion out of total goods and services imports of $2228.0 billion, according to the latest NIPA release.
I’m glad you found this normalization of interest. However, as I mentioned in my previous post on this subject of tradables, the categorization I use is not uncontentious. Some people might argue other categories are also tradable. I think many trade economists — especially those working on endogenous tradability — might argue that my calculations overstate the share of tradables. That is because micro/firm level evidence suggests that many firms in “export sectors” (even at a high level of disaggregation in the NAICS system) do not export. This point explains why normalization by GDP — rather than tradables VA — is so common. We can (more or less) measure GDP.
kharris: I agree that this is an interesting question. The idea that inventory adjustment has been “offshored” is consistent with the idea of vertical specialization.
If I go to the BEA real value added by industry, Gross Domestic Product by industry, data that goes back to 1987 it shows that manufacturing share of gdp follows a very similar pattern to the industrial production index. It was 13.8% of real GDP in 2005 as compared to 13.4% in 1987. If fell as low as 12.7% in the 1991 recession and rose to a peak of 14.5% of real GDP in 2000.
On a secular basis employment in manufacturing is declining, but with the rapid growth of productivity in manufacturing is its’ share of gdp really falling? The related question is the tradeable sector of the economy really falling as you think?
I have my doubts.
spencer: What’s true is if you take the old style (fixed base) deflators to deflated manufacturing output and GDP into real terms, then the real shares measure is conceptually meaningful. I gather that’s what you’ve done. Of course, what is also true is that with fixed base weights, the interpretation of what is meant by real magnitudes gets more cloudy when there is rapid price change, as is the case with semiconductors.
The more important question is whether I really think the share of tradables output in GDP is declining. Perhaps not on a trend basis (in the early years, not all manufacturing was tradable, while in recent years a higher proportion was), but perhaps over the last few years it has decline with the construction boom.