Almost old news, the February 13 BEA/Census release for December trade provided ample grist for the mill. Insightful perspective was provided by Brad Setser and David Altig. Here I try to add a few other insights.
First, one can get an idea of how much the December trade release will revise downward the BEA’s estimates of 4th quarter net exports by examining the monthly trade balance to GDP ratio versus the quarterly net exports to GDP ratio, for both total and ex.-oil series. The comparison is not straightforward because there are differences in how the trade figures and the NIPA figures are compiled and reported; but a quick glance tells one that the total and the ex.-oil net exports figure will be revised downward in a substantial manner. In addition, both total deficit series (trade, net exports) will look slightly worse in q4 because nominal GDP will be revised downward (see Big Picture for a discussion of the impact on q4 real GDP growth).
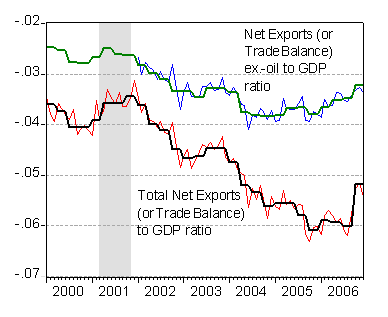
Figure 1: Trade Balance ex.-oil (blue) and Net Exports ex.-oil (green) and Trade Balance (red) and Net Exports (black) to GDP ratio. Source: BEA, January 31 NIPA release and BEA/Census, February 13 trade release; and author’s calculations.
Second, despite the deterioration, the conclusion that there is a stabilization (at a large negative number) in the trade balance/GDP ratio still seems to stand. I think part of the improvement is coming from greater exchange rate pass through.
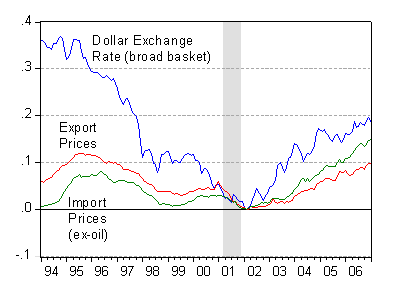
Figure 2: Log Federal Reserve nominal trade weighted dollar exchange rate (blue), log goods export prices (red), and log goods ex.-oil import prices (green). Source: FRB via St. Louis Fed FRED II, and BLS, February 14 import/export price release; and author’s calculations.
As recounted in previous posts, exchange rate pass through had seemed quite low. For instance, the exchange rate depreciation from 2002M02 had been substantial, nearly 10% by mid-’03, with around only a 2% increase in import prices (both calculated in log terms). By end of 2006, the dollar was about 20% weaker, and import prices about 15% higher. Export prices have risen less — about 10% — so in this context the export performance up until now has been quite remarkable, and mainly attributable to the resurgence in growth abroad.
Third, despite these trends, the December trade release should give pause for thought in terms of hopes for continued rapid growth in exports, relative to imports.
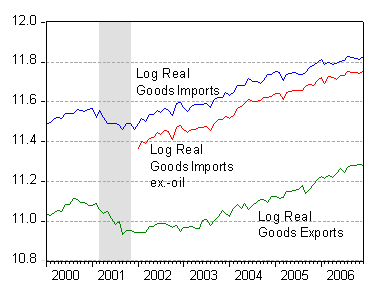
Figure 3: Log real goods imports, log real goods imports ex.-oil, and log real goods exports. Source: BEA/Census, February 13 trade release; and BLS February 14 import/export price release; and author’s calculations.
Real goods exports growth seem to have tailed off in December, as shown in Figure 3. Nominal services exports (for which I don’t have a deflator) maintained a healthy growth rate of 11% on an annualized basis, albeit down from the 21% recorded in November. Since service exports are sizable — at about 29% of total — hope springs eternal. In any case, this argues for encouraging more tourism, among other things (at least for those who think the deficit is a problem).
Fourth, on a related point, let me step back from the micro aspects of the trade balance, and think about how fiscal policy affects the trade deficit. In this regard, let me refer to David Altig’s excellent observation on Macroblog regarding the divergence between the two deficits — between the budget and trade deficit, a favorite topic of mine (see here and here). This is a well known phenomenon; if his graph has been extended backward, the 1980’s would have exhibited a high correlation between the two deficits. This is shown in this Figure 4:
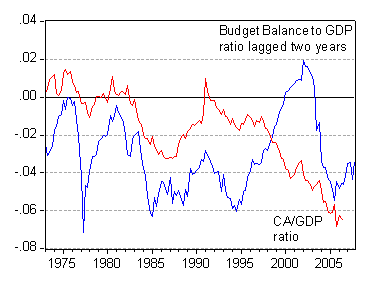
Figure 4: Budget balance to GDP ratio, lagged two years (blue) and Current Account to GDP ratio (red). Source: BEA, January 31 NIPA release and author’s calculations.
But, with multiple shocks, even in a simple Keynesian model, the two can diverge. What is true is that when fiscal shocks predominate, the two series will tend to covary. For instance, in a simple Keynesian model with investment, a positive shock to investment will drive up tax receipts and drive down the trade balance. When fiscal shocks are large (such as after 2001), we see a correlation, albeit with a lag. This can be seen even more clearly if we look at annualized two year changes in these two variables, as displayed in Figure 5.
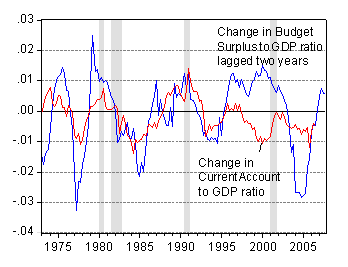
Figure 5: Annualized two year change in budget balance to GDP ratio, lagged two years (blue) and Current Account to GDP ratio (red). Source: BEA, January 31 NIPA release and author’s calculations.
So I agree with David Altig — they’re not always twins, and perhaps not quite even siblings — except perhaps in growth rates.
By the way, the positive change in the budget balance to GDP ratio should not be taken to say we’re out of the woods — the implied correlation for the change in the current account to GDP ratio would leave us at a large negative deficit for a number of years.
Technorati Tags: budget deficits,
trade deficits,
twin deficits,
exchange rate pass through
Interesting post, I wasn’t thinking about it in this context.
second the “interesting post” comment; i was struck by the improvement in the non-oil trade balance to GDP ratio. Basically all the 2004 deterioration has been reversed, which is interesting. i think that most of this stems from a reversal vis a vis Europe, Mexico and Canada (Mexico and Canada are hard to see b/c the bilateral data bundles oil/ energy and non-oil); the US trade with non-oil asia (East Asia) is certainly still rising as a share of GDP (tho not as fast). I suspect the story for why the 2002-03 depreciation didn’t initially seem to have a bigger impact is that in the 02-03 period, the US was still dealing with the lagged impact of $ strength in 2001, plus weakness in those latin EMs that buy lots of US goods and the headwind from the strong pick up in US import demand associated with recovery, the big fiscal stimulus of the time and the discovery of the housing ATM.
the log data on real goods exports also shows why I am a bit worried about sustaaning strong export growth in 07 better than anything i have done. thanks.