The equity indices take a dive. Is this in spite of — or because of — the fundamentals?
Figure 1 depicts the evolution of the S&P 500 over the past five days.
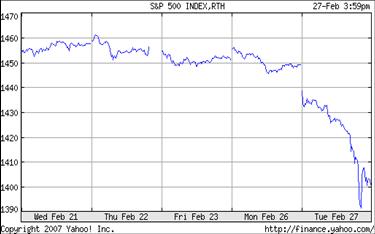
Figure 1: S&P 500 index. Source: finance.yahoo.com.
Here is the key series that is cited as one of the proximate causes of the sell-off (along with China and subprime mortgages)[added 4:30 PM]. Also depicted is the total durable goods order series.
Figure 2: Log new durable goods orders, in millions of dollars, SA, and three month moving average (red). Source: St. Louis Fed FREDII.
Figure 3: Log new nondefense capital goods orders ex. aircraft in millions of dollars, SA, and three month moving average (red). Source: St. Louis Fed FREDII.
Both series exhibit a pronounced downward movement, even in the three month moving average. While this has happened several times before in the period since the end of the last recession, it has not happened in the capital goods series in the last two and a half years.
What about capacity utilization and industrial production? As Jim mentioned in a recent post, both have been exhibiting worrisome trends. Capacity utilization in manufacturing is substantially below mid 2006 levels, while industrial production (an upward trending variable) has been trending sideways since the middle of last year.
Figure 4: Capacity utilization in manufacturing (blue) and log industrial production (red), both seasonally adjusted. Source: St. Louis Fed FREDII.
What about the consumer? 70% of GDP is accounted for by consumption, so the consumer is key. The real retail and food sales and especially the retail ex. food sales series growth rates are essentially zero over the last year, as shown in Figure 5.
Figure 5: Log retail and food sales deflated by CPI-All (blue) and log retail sales deflated by CPI-All (green), both seasonally adjusted; and three month moving averages (respectively, red and black). Source: St. Louis Fed FREDII.
These trends in spending are interesting given the fact that population and real GDP are growing over time. (I’ll leave the discussion of the housing market to others, such as Calculated Risk).
Finally, not a “fundamental” but another forward looking indicator: the yield curve. As has been discussed often, here and elsewhere, there is econometric work supporting the proposition that the term spread no longer predicts recessions — a binary variable — well (although it still might predict economic activity). The ten year constant maturity minus 3 month spread is depicted in Figure 6. The red square is the observation for today.
Figure 6: Ten year constant maturity Treasury yield minus three month Treasury yield. Source: St. Louis Fed FREDII.
Given these indicators, maybe one should not be surprised by the equity market movements. Even if there’s no recession on the horizon, a more marked slowdown should force downward the expected stream of earnings (and hence dividends) into the future.
Technorati Tags: recession,
GDP,
capacity utilization,
industrialproduction,
retail sales, and
term spread.
Passive voice alert — “is cited”
The drop in durable goods was cited by whom as the proximate cause of the slide in the S&P? I kinda heard that the biggest drop in a decade in Chinese shares had something to do with it. As supporting evidence, I offer CAT, which began the day as the weakest US equity on the face of the planet, though by the end of the day, there were worse performers. CAT’s CEO found a microphone and pointed out that his firm has only $1 bln in revenues in China (China, see?) and so equity traders needed to get a life and stop selling his shares.
I agree there is trouble in durables land, but there is way more going on in the world than a single data print. Press reports on margin borrowing, trouble for lots of investors from sub-prime lending/lender exposure, over-extended everything, big appetites for risk leading to indigestion and so on. A day like today is very likely not due to a single cause, even a single proximate cause.
I would be very curious to know who the mystery passive voice is who cites durables as the source of today’s woes.
kharris: OK, good point. I’ve changed the text (in bold italics). Durables is cited in this Reuters article.
MC,
My quibble is now OBE (overtaken by edit) so I wouldn’t mind if you kill it to clean up the comments.
Asian stocks have opened up Weds morning and continued the plunge:
http://www.bloomberg.com/apps/news?pid=20601080&sid=al2u7e4RlTeg&refer=asia
To be fair, US futures kept going down after the close. We were there first! USA! USA! ..though there is a bit of bounce now. ES off the lows, CL off the lows, even the carry currencies seeing a hint of a lift.
I knew there was a reason I picked up some short-dated calls at the close: just in case.
Mr. Chinn: don’t forget the CFNAI.
There is nothing on the horizon that seems to be producing a big change in the discount rate for future eps — rates or inflation on the PE.
So that leaves the issue of earnings. If we are slipping into a stagnation scenario it would imply that we are unlikely to see sufficient productivity growth to support the solid eps growth now assumed by the market. So don’t the weakness in consumer spending, capital spending and housing imply that the market estimate of eps in the short run seem highly suspect.
the second factor you might want to look at is quality spreads. Historically, quality spreads move in lock step with capacity utilization. IE, the market does not start to worry about default risk or
bad loans until such development seem very imminent.
So the recent weakness in capacity utilization and deterioration in quality spreads imply that the market is starting to discount significantly slower growth (both gdp & eps) but it is not seeing a strong enough interest rate rally to offset this weakness.
Nice charts. Given that journalists are looking to ascribe a specific reason to every intraday move in the markets, it’s no surprise they have put forward things such as the durable goods number (it is something concrete which they can talk about). Unfortunately, I think it has close to nothing to do with the widespread fallout, and they would do better to look at the bigger picture – eg: uninterrupted equity mkt growth around the world for a sustained period, supported by low volatility, a benign inflation outlook and a very low cost of financing. With the wider lens, I think the fall out becomes a little more understandable, but it is not really in the remit of Newswire journalists to look through the wider lens.
But isn’t that why we come to the economists –for the wider lens and one element of that broader view is the durable goods number, –for some explanation of an exceptional intraday move in the markets.
With so few large players it seems to me that one or two exits can startle this fragile market that frankly seems to have adopted a nervous posture of holding onto its earnings rather than reinvesting. This position does not speak to great expectations from consumer demand, it seems to me.
Appreciate the nice cluster of persuasive factors illustrating the brittle nature of this economy, Menzie, and the suggestion that this is not likely to be an isolated move.
Nice illuminating charts, Professor.
Should be fun tomorrow, with consumer spending reported (retail sales were flat in Jan., so I’m guessing that consumer spending will underwhelm, too) and revision downward of Q4 GDP.
I’ve seen this correction coming; what was surprising to me was that gold went down, too; such did not happen in Oct. ’87 nor after 9/11/01; my gold mining stocks took a 5% hit, today; ouch!
It seems much more like 1987 revisited than any sort of collective revelation about the “economic situation” today (but then, I’m not an economist).
Oh my…looks like lots and lots of folks were dancing with one foot out the door (or with the index fingers taped to the enter [or send] keys).
At least we now know that Paulson has a set on him. Can’t wait for the Chinese response.
War by other means. Loads o’ fun.
If he can tip them into a Japanese style decade long malaise I will be first in line to shake his hand.
For those who have no idea what I am talking about…sorry. I’ll bet Bill Cara does.
Menzie. Great charts. Nice post. One question: what fraction of US manufacturing output(or say durable goods production) is exported? I am trying to understand whether all of this suggests a strong slowdown in export growth. Or whether it indicates that one sector where the US produces but doesn’t export much (autos) is driving the broader data, and weakness in say domestic auto production and the manufacture of goods for new homes partially offset by ongoing export strength. Any thoughts?
GDP data revised spending on equipment and software to -3.2% from a prior -1.8%. Spending on non-residential structures was revised to -0.8% from +2.8%. The non-residential fixed investment category which encompasses both was revised to -2.4% from -0.4%. Not happy news.
Menzie,
Good analysis and data.
JuanBobsDad wrote:
It seems much more like 1987 revisited than any sort of collective revelation about the “economic situation” today (but then, I’m not an economist).
Dad,
You may be more perceptive than you intended. Both events were preceeded by Greenspan shooting off his mouth. In 1987 it was saying we didn’t need a strong dollar. In 2007 it was that the US is headed for recession. It is sad to see a brilliant man seduced by the limelight.
wcw: Yup, the CFNAI was indeed disapointing.
spencer: I agree that the stock prices should be the present discounted value of the future stream of dividends, viz., P=PDV(future Dividends, required rate of return on equities), and hence of earnings; I further agree that it’s unclear which one has moved the most to change asset prices. My guess is both — I focused on the fundamentals, partly because I have a hard time getting a good measure of the required rate of return on equities which is in turn a composite of the risk free rate (which we can observe) and the risk premium on equities, which is presumably moving inversely with “risk appetite”. My cursory examination shows the typical measures (BAA-Treasury spread) is not giving a signal for a lot higher risk aversion, but there are probably better indicators out there.
brad setser: US exports of durables in 2006 was $693.3 billion; total value added in durable goods was $1833.9 billion. Hence, US exports of durables accounted for 37.8% of value added in this sector.
I’m not sure if this answers your question, though. My understanding is export growth was largely unchanged in this revision, while import growth was revised upward. The big hits were in fixed investment, both residential and particularly non-residential (as noted by kharris).
Well, Greenspan just spoke again in Asia and the market took another 200 point crash. The fundamentals do indicate softness but where someone like Bernanke or Greenspan speak millions listen and act. I simply can believe that Greenspan mentioned recession again.