The Society Survey of Professional Forecasters latest report (dated 13 February) has been released. The mean forecast is quite interesting, in light of Jim’s recent post on industrial production and the growth outlook.
From the release:
Forecasters See Higher Growth, Stronger Labor Market in 2007
The forecasters have raised their estimates for real GDP growth this year. On a year-over-year basis, real GDP is seen growing 2.8 percent this year, up from the forecasters’ previous estimate of 2.6 percent. A slightly stronger labor market will accompany the outlook for growth. Nonfarm payroll employment will increase at a rate of 135,000 jobs per month in 2007, up slightly from 119,000 previously, while the unemployment rate will average 4.7 percent, down from 4.8 percent.
As the table below shows, the forecasters see real GDP growing 3.0 percent in 2008 and the unemployment rate rising to 4.8 percent.
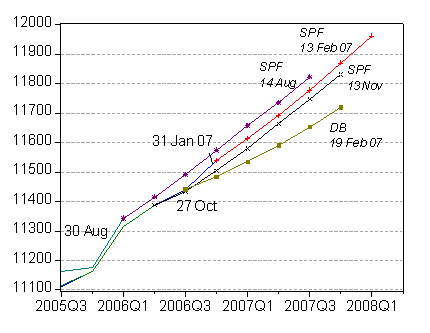
In figure 1, the most recent mean forecasts, along with the two previous forecasts (and relevant vintages of real GDP) are presented.

Figure 1: Real GDP and Society of Professional Forecasters’ forecasts for 14 Aug 2006 (purple *), 13 Nov 2006 (black x) and 13 February 2007 (red +), and Deutsche Bank forecast of 19 February 2007 (green squares), all calculated backing out levels from growth rates. Sources: BEA NIPA releases, SPF via Philadelphia Fed, Deutsche Bank, Global Economic Perspectives, 19 February 2007, and author’s calculations.
The figure also demonstrates that the optimism has waned, and waxed, over the past few quarters (for previous discussion, see this post). One point to take into account is that 13 February is the same day as the trade release, which reported an above consensus trade deficit (see here). Many estimates of 2006Q4 GDP growth were revised downward in light of that announcement.
Deutsche Bank, which has as far as I can tell been below consensus on growth rates, states in its 19 February issue of Global Economic Perspectives:
Recent US data have pointed to a notable reduction in the Q4 GDP growth rate. Our US economics team sees growth being marked down to as low as 1-1/2%, with little change in its sub-2% projection for Q1 growth. A reasonable guess is that the consensus/Fed view would put Q4 growth near 2%, with Q1 growth marked up a bit, to around 2-1/2%. Manufacturing activity appears to have been depressed recently by an ongoing inventory adjustment, but the positive momentum in the services sector has remained solidly intact, judging by the ISM
survey and the continuing low level of initial jobless claims (until this week’s apparently weather-related jump)…. (p. 7)
I’ve plotted the implied path of real GDP in Figure 1. The DB forecast (green boxes) is for less than 2% growth (SAAR) in the first half of the 2007, and slightly above 2% growth in the last half, for an overall growth rate of 2% (Q4/Q4). This is substantially below the 2.8% Q4/Q4 mean rate from the Society of Professional Forecasters, as well as the 2.9% growth forecasted by the Administration in its Troika forecast from November 2006.
For another perspective numerically closer to consensus, John Kitchen reports as of 16 February his 2007Q1 Underlying growth measure (RTF-U) at 2.8% and Quarterly variation measure (RTF-Q) at 2.3%.
An interesting long term forecast: The new SPF survey has trimmed the ten year annual labor productivity growth down to 2.20 from the previous survey’s forecast of 2.44. This contrasts with the Administration’s rosy forecast of productivity growth over the next six years of 2.6%.
Technorati Tags: recession,
GDP, productivity, trade release, and
forecasts.
Put it in the tickler file and pull out in say December 07. Will they be right or will 07 be the ‘New 2001’?
Remind me again – what productivity growth estimates do the Social Security Trustees use in their low-cost estimate?
dryfly: Indeed, 2001 is a cautionary tale (as noted here)
kharris: The 2006 Social Security Trustees Report summary indicates 1.7 percent is the assumed long run productivity growth rate.
Very small point, but it’s the “Survey of Professional Forecasters”, not the “Society”
Anonymous: Thanks. It’s been fixed now.
When the Social Security Trustees talk about productivity they are not talking about the same thing as the rest of us.
Their concept of productivity is closer to real gdp per employed person. What they do is add private and public employment together to get the hours worked estimate and use the output measure of both business and government. But in creating government output data the BEA assumes that public sector productivity is zero. So SS is using a definition of productivity that generates a lowball estimate.
Perhaps someone can help me. The implication is that the FED controls inflation. If that is the case how can anyone forecast inflation without knowing what is going on in the heads of the FED governors? Stated another way is inflation monetary or fiscal?
DickF,
Yes, inflation is monetary and fiscal. So the problem you mention is worse than you suggest. How can anyone forecast inflation without knowing what the Fed and fiscal policy makers have in their heads? That’s what makes it fun.