The NIPA release of January 31 contained a couple of surprises, including on the international front. The external accounts did provide a bit of a kick on growth, as shown in Jim Hamilton’s post.
Figure 1 shows the net exports (red) and net exports ex.-oil imports (blue) as a share of GDP. What is clear is that the sharp decline in the trade deficit is mainly — but not entirely — due to a decline in the value of oil imports.
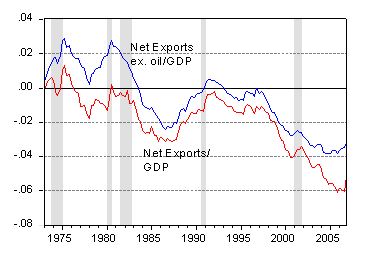
Figure 1: Net exports (red) and net exports ex.-oil imports (blue) to GDP ratio. Source: BEA NIPA release (31 January) and author’s calculations.
One key question is whether the decline in the value of oil imports is due to a reduction in price or quantity. The fourth quarter decline is largely due to decreasing oil prices (the petroleum and petroleum product price index fell from 242.2 to 202), although, as shown in Figure 2, the quantity fell by 6% (log terms).
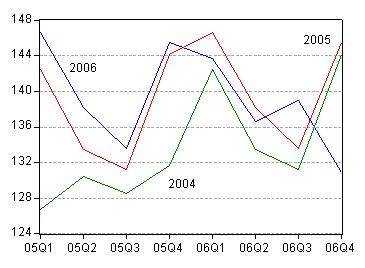
Figure 2: Real imports of petroleum and petroleum products, in Ch.2000$ SAAR, in 2006 (blue), lagged one year (red) and lagged two years (green) Source: BEA NIPA release (31 January).
The graph seems to verify press accounts asserting decreased demand due to higher oil prices; in 2004 (green) oil import quantities were trending up, in 2005 (red) they were trending sideways, and in 2006 (blue), trending slightly downward (although the q4 drop might have been accentuated by inventory buildup in earlier quarters in anticipation of an active hurricane season).
Figure 1 also highlights the fact that the ex.-oil trade deficit (as a share of GDP) has been falling gradually over the past year. Nonetheless, the rate of trade deficit reduction has been, in some sense, very slow. In Figure 3, the ex.-oil normalized trade balance, and the trade weighted exchange rate of the dollar lagged two years, are displayed.
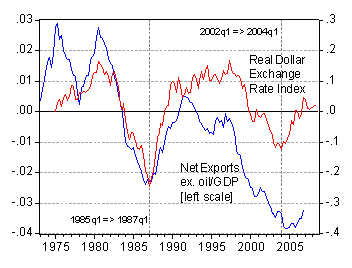
Figure 3: Net exports (ex.-oil imports (blue) to GDP ratio, and log real exchange rate of the dollar against broad basket of currencies. Source: BEA NIPA release (31 January), Federal Reserve Board via FRED II, and author’s calculations.
While the trends clearly diverge, the turning points are remarkably correlated. Two years after the 1985q1 peak in the dollar’s value, the US trade balance started to improve. Two years after the 2002q1 dollar peak, the ex.-oil trade balance was still deteriorating. It’s only in the last year that there’s been some improvement, and a gradual one at that.
Goods exports have been growing faster than non-oil goods imports since 2005q2, as shown in Figure 4.
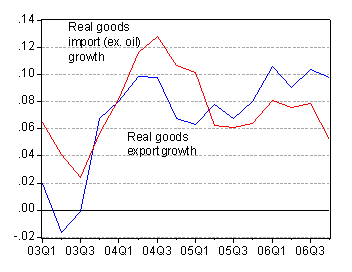
Figure 4: Annual growth rates of real goods exports (blue) and real goods imports ex.-oil (red) (in Ch.2000$), calculated as 4-quarter log differences. Source: BEA NIPA release (31 January) and author’s calculations.
However, since the gap between real exports (blue) and real non-oil imports (red) is so large, export growth must exceed import growth by a wide margin for a very long period in order to close the gap. Hence, despite the rapid pace of export growth and import compression in 2006q4, the gap remains large. In log terms, real non-oil goods imports remain 47% greater than real goods exports.
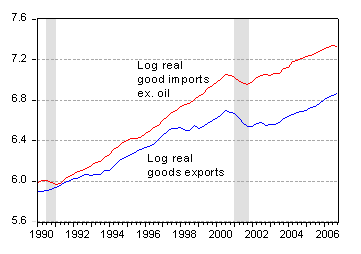
Figure 5: Log real goods exports (blue) and real imports ex.-oil (red), in Ch.2000$. Source: BEA NIPA release (31 January).
So, good news, but significant challenges remain. And of course, any political crises or oil production disruptions might further widen the total trade deficit. And it is that financial quantity that must be financed by capital inflows from foreign investors and central banks. (Interestingly, non-oil imports tend to decline multiple quarters before recessions, so don’t wish for too many quarters of real ex.-oil import decline…).
Technorati Tags: trade deficits,
exchange rate,
oil imports,
oil prices
Menzie — great analysis. I am having a hard time getting my head around the source of the fall in real imports (if I am reading the NIPA data correctly) in q4 …
the bilateral data isn’t seasonally adjusted, but on a y/y basis the q4 growth in imports from China was very strong (stronger than the y/y increase in q3) consistent with the Chinese data. I don’t think us imports from japan slowed in q4 — that doesn’t really seem to square with Toyota and Honda sales (judging from the press). Import growth from europe did seem to be weak, but I am still a bit puzzled by the overall fall to be honest … especially with the strong consumer spending data. any ideas?
Jimminey. Brad is puzzled about q4 Imports…there goes my plan of just lifting the explanation off his site. I was hoping that the registering of the oil imports with that huge price drop was somehow connected to the neg price deflator…similarly connected to the 1.5% diff in q3-q4 Imports and in GDP (q3 final and q4 advance). It isn’t as simple as ‘we just imported less dollars worth of the same number (ok 6% less in fact) of barrels’ is it?
Ok, Menzie, I’d say it was a great analysis too, but QED, I’m not lifting the solution of ‘q4 Imports’ off your post either.
Brad Setser and calmo: I think this is the driver of the drop in non-oil imports: Real non durable industrial supplies dropped 19% in 2006q4 on an annualized q/q rate (7.5% q4/q4).
Look at the monthly real trade balance data and you see a very significant turn in the data this year from a strong downtrend to a flat to very modest upturn. But in the GDP accounts a swing from a falling trend to a flat trend can make a significant contribution to real growth.
I suspect the reason we are seeing weak industrial imports is that we were having involuntary inventory accumulation in the second half of 2006. In todays world inventory liquidation now show up as much or more as a cut in imports rather then a cut in orders to domestic suppliers. This is one of the reasons that the economy has been more stable in recent years — we now export inventory adjustments.
Thanks for chasing me to Table 4.2.1 line 27, Menzie (-18.7), a loner large negative in that series [The Durable goods component of which was an unusual large negative (-19.8) Nondurables was large but not unusual (-17.2)]…and a few lines further down for petroleum products (-21.2) but not a loner in that volatile series.
Capital goods looks modest but is actually way under its usual strong positive. Same for computers.
Consumer goods was a strong 15 but swamped by these other components.
So maybe in addition to industrial non-petroleum durables we have other supporting factors (sizable reductions in Capital goods, computers, petroleum products) that over-ride the usual consumer goods we think of when we say “imports”.
Ok, I’m getting there (head somewhat around it). We’re not tiring of the imported consumer goods (and this confirms the unmoved savings rate) as much as the capital goods needed to make them.
any ideas?
I hate to even bring it up but – is there ‘dark matter’ in there somewhere? Goofy transfer pricing or some other exchange rate driven exaggeration that skews the numbers?
Offshore branch plants according to spencer made the difference this quarter (but not last quarter or the one before that owing to the onset of the housing slowdown only now asserting itself)[nevamind the Fed speak to the contrary]. The usual industrial imports (it would help if I could put my finger on this: tooling machinery?) sagged, suggesting that those domestic processes requiring them were downsized/delayed/rerouted to more profitable areas/times.
Maybe. So we just had a large inventory build as the result of forcasting the housing boom to continue forever…and production plans had to be scaled back to accommodate the new reality (the reality that is not piercing the mind of the Fed) that only some of us can see starting last June?
Ok, I think I see some of spencer’s view but not the abrupt change in Imports since last quarter which looks like a confluence of several factors to me… no Dark Matter dryfly.
By far, by far, by far the key quote is:
What you hear is the hissing sound that empty consumer wallets make at the beginning of a depression (recession?).
Ok, anony, by far the most disconcerting thing about your post was, that as key as you thought that “key quote” was, you were unable to expand on the “multiple quarters” or “too many quarters” in Menzie’s little hornet of a remark.
Look, Menzie is telling us we have many quarters to go before we get a recession…if ever, and we have the luxury of waiting for more ex-oil import declines to beef up that expectation.
Last ting: “the hissing sound that empty consumer wallets make” is by far, by far, by far…the key that needs to be recut in your post.
Cats hiss, maybe even snakes (TV snakes!) but wallets? empty non-cat-bearing consumer wallets?
I don’t think so.
The text of this post states “Figure 1 shows the net exports (blue) and net exports ex.-oil imports (red) as a share of GDP”. However, the graph is labeled the other way around. Which is correct? My guess is the graph is correct. Net exports should be much lower than net exports excluding oil.
Peter Schaeffer: You’re right. Thanks for catching that. It’s fixed now.