The Bureau of Labor Statistics reported today that U.S. nonfarm payrolls, as measured by their survey of establishments, increased by a seasonally adjusted 97,000 workers in February.
Calculated Risk declares “overall this is a solid report.” CR’s optimism appears to derive partly from the fact that today’s BLS release also includes substantial upward revisions for the employment growth now calculated for December and January, and partly because the significant February declines in construction employment, which both CR and I are expecting to continue, were offset by gains in services.
I continue to urge that these numbers be combined with those from
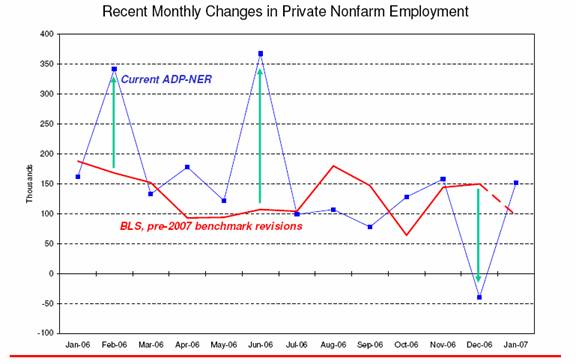
Automatic Data Processing, who estimate that employment only grew by 57,000, and the separate BLS survey of households which signaled that seasonally-adjusted U.S. employment actually declined in February by 38,000 jobs. The ADP estimates have previously been greeted with a bit of skepticism by many observers. Admittedly, the previous estimates from ADP included some big misses relative to the more-trusted BLS nonfarm payroll numbers, as shown in the graph below.
 |
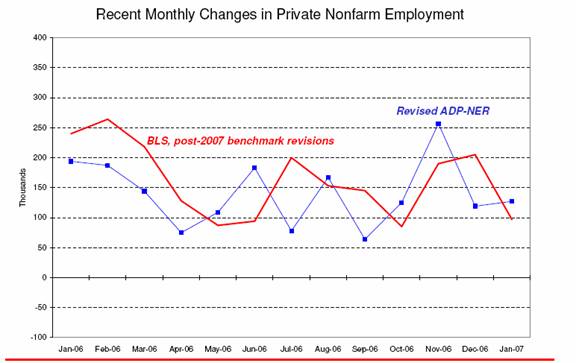
However, ADP has recently adopted some
important changes in how their index is constructed. Among other changes, their measure is now based on data for 23 million workers (rather than the “mere” 7 million covered originally). They’ve also tried to correct some of the overfitting. Part of their methodology involves regressing the reported BLS nonfarm number on what the ADP numbers imply for given categories, and then aggregating the categories back up. There’s a danger of overfitting with such a method, getting something that would look great within sample but fall apart out of sample. By collapsing the number of cells from the original 19 industries to a smaller group of 10 now, some of that problem will be reduced. Nevertheless, if I were producing these estimates, I would have used additional shrinkage of each cell toward the current aggregate and previous values, as well as shrink the regression weights toward known or separately estimated cell fractions. But ADP believes that the steps they have taken will be enough to eliminate the misses noted above:
 |
In any case, it remains unambiguously true that the ADP database contains some very useful information not included in the nonfarm payroll estimates, and that the separate household survey has important information missed by both the others. Even if you’re not persuaded that the methodological changes by ADP have solved all the problems with that series, I believe it still makes sense to combine the three measures. A conservative approach (by which I mean, one still skeptical of the ADP numbers) might be to use the weights I’d been recommending, namely 0.8 for the initial nonfarm payroll, and 0.1 for ADP and household. That gives you an estimate of employment growth for February of 80,000 new jobs rather than the 97,000 claimed by BLS.
In other words, an open-minded person should believe it’s fairly likely that the BLS nonfarm payroll numbers have overestimated the amount of February job growth.
UPDATE:
Calculated Risk in a comment below notes that I’ve made a tremendous blunder here in overlooking the distinction between “private nonfarm employment”, which the 57,000 ADP number describes, and “nonfarm payroll employment”, which the 97,000 BLS number describes, the difference between them being the 39,000 additional government jobs reported by BLS for February. So the 57,000 ADP figure should be compared with 97,000 – 39,000 = 58,000; in other words, the ADP and BLS payroll are in substantial agreement this month.
CR reports that the average government employment gain is 21,000, so the distinction between “private nonfarm employment” and “nonfarm payroll employment” is much bigger this month than it usually is.
Therefore the calculation I should have made is (0.8)(97) + (0.1)(57+39) – (0.1)(38) = 83,000 (rather than 80,000 as reported in the original post) as a better estimate than 97,000 of the number of new jobs for February. It’s pulled down by the household survey alone rather than by household plus ADP.
Technorati Tags: macroeconomics,
employment,
BLS,
BLS household survey,
ADP
Professor, Are you adjusting the ADP report for govnerment sector jobs before combining with the other two series?
The ADP report only covers the private sector, and was therefore for 57K private sector jobs. The BLS payroll report showed 58K private sector jobs (and 39K government jobs). I’ve had my reservations, but ADP did very well this month.
For government sector jobs, the average for the last 10 years is about 21K added per month, so this month was a litte high.
Best Wishes.
From where I sit in Silicon Valley, I welcome a slowing of job growth. Why? It sure seems that, in general, job seekers are getting scarce on the ground.
A good rule of thumb is when street advertising seeks workers, not customers, we’re topping out on the labor pool.
In my own industry, our employment agencies are reporting that ALL qualified, experienced workers seeking work are gainfully and fully employed. I’ve been begging my management to find extra help for my group, even college kids. Our clients are complaining that we are not spending MORE money on labor.
I understand the Professor’s thread was a technical one about data series but the broader ramifications can only be assessed when evaluated against the unemployment rate(s).
Mr. Somsel, wouldn’t be more accurate to say that job seekers are scarce at the wages you are willing to pay? Especially in Silicon Valley, skilled people are quite willing to seek a job across the street if the incentives are attractive.
Job MOBILITY is certainly still active but that results in no NET addition to the labor pool. At some point higher wages have a decreasing ability to increase the number of jobs created. (Inelasticity is the correct economics phrase I believe.)
Conversely, at some point higher wages result in fewer new jobs being created as substitutes (capital, automation) are found.
I assume you are talking about highly skilled jobs like engineering. Presumably there is a shortage because people are selecting careers like marketing, sales, finance, law or business administration which either pay more or require less effort. You know, the invisible hand and all that. Engineering wages are depressed by off-shoring and the importation of cheaper foreign engineers on H-1b visas making engineering degrees less attractive to American students. A market in which there would be a constant pool of unemployed engineers would only exacerbate the trend.
On the other hand, if there is a shortage of engineers, I guess the economists would say that they will be allocated to the stronger more efficient companies paying higher wages and the weaker less efficient companies will rightfully whither and die. Again the invisible hand.
Given that 2/3s of the workforce would love to have a different job, anyone that can’t find anyone is just saying their work is not valuable enough to offer higher pay. It is probably those companies offering “competitive” or “market” pay. Why should anyone change employment for the pleasure of it? In most cases this a local phenomena. All businesses feel they must be located near others for network effects and end up competing for the same labor pool. Managers too often prefer excuses to results.
Anybody who can’t find personnel in this labor market is a moron. There are still about 2 million people in the NILF that were proficient enough to be replaced by foriegn workers since the 01 recession.
Beyond that, I doubt that overall job growth has even kept up with high school graduation rates.
Personnel firms and the AILA are playing games with the skilled labor market — immigrant labor can be coerced into longer commission periods and are less likely to go direct with the employer. (Guestworkers aren’t cheaper because business pays personnel commissions for longer durations.)
If you do your homework, there are over 1 million legal immigrant (replacement) worker admissions every year. A prolonged period of unemployment for a domestic worker will cause the personnel screener to disqualify, no matter how well qualified the domestic worker.