Are declining capital imports growth rates an indicator of recession?
The January trade figures are in; the trade deficit was slightly smaller — at $59.1 billion — than the
consensus of $59.8 billion. The improvement in the trade balance ex. oil imports was even more marked, as shown
in Figure 1. In other words, this month’s worth of data largely reinforces the trends discussed in my previous post on this
subject. So in many respects, I think this was good news to the extent that a smaller deficit places us less at the whims of foreign investors and central banks. (Coverage by Bloomberg and Reuters.)
Figure 1: Trade Balance (blue) and trade balance ex.-oil (red) and Bloomberg Consensus (green), in millions of dollars per month, seasonally adjusted. Source: BEA/Census March 9th trade release; Bloomberg.com, and author’s calculations.
However, the trend in the trade balance depends on both exports and imports. Real goods export growth in the past two months has been only about 7.2% y/y, down from earlier months. Moreover, on the import side, we know that imports are a function of at least two factors: income and the real exchange rate.
So to the extent that aggregate demand might be slowing, the improving trade balance might be
a manifestation of inventory adjustment (see Haver’s discussion, which is related to Econbrowser reader spencer‘s comments in this post), or — more troubling — a harbinger of slower growth or even recession. This possibility inspired me to look at the forward looking components of import demand — namely capital goods imports (which in turn are linked to equipment investment growth that leads GDP growth). The two year growth rate (in log terms) of capital imports, while still a healthy eight+ percent, is declining (see Figure 2). In real terms, the growth rate is slightly higher.
Figure 2: Two year annualized growth rate for nominal capital goods imports (blue) and real capital goods imports(red) Source: BEA/Census March 9th trade release; and BLS import/export price release of February, and author’s calculations.
An examination of the historical record — displayed in Figure 3 — is suggestive. Over the past 30 odd years, when the annualized two year growth rate of capital goods imports declines to 10 percent (log terms) or below, the U.S. economy is either about to go into recession, or already in one.
Figure 3: Two year annualized growth rate in real non-petroleum goods imports (blue) and capital goods imports (red). NBER recession dates shaded gray. Source: BEA February 28 NIPA release, NBER, and author’s calculations.
There are a couple of exceptions. In 1986, two-year-growth declines below 10 percent, but no recession occurs. In 1980, the economy goes into recession, yet two year growth at the beginning of the recession is above 20 percent. Hence, this indicator yields both false positives and false negatives. Furthermore, it’s not a leading indicator. Rather it seems to correlate with recessions. Food for thought as concern about recession rises.
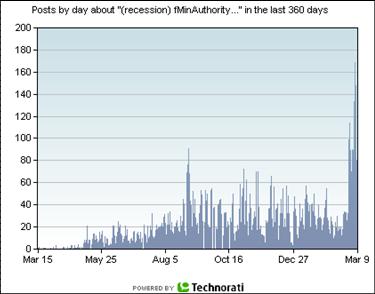
Figure 4: Count of posts including the word “recession” in all languages, on all blogs “with some authority”. Source: Technorati.
Technorati Tags: capital goods,
trade deficits,
recession,
trade deficit
Great analysis Menzie.
I probably shouldn’t say this, but when I saw the rise in posts about recessions in blogs with some authority, i couldn’t help but wonder if Dr. Roubini is distorting the statistics, since I think almost all of his recent posts say “hard landing recession ahead” and he is writing more often! But I also noticed that Dr. Hamilton is getting a bit bearish as well.
Very interesting post, professor. One question, why do you use the two-year growth rate instead of say, one-year? As the two-year rate changes slowly, I am not surprised that it is not a leading indicator. Wouldn’t a one-year growth rate give a more prompt signal?
brad setser: I was thinking that the technorati index was reminiscent of “content analysis” used by intelligence agencies in decades past, and resurrected in Naisbett’s Megatrends during the 1980’s. Probably as reliable as those methods were.
I must say that it seems more and more the case that the consensus is for a downturn (I’m keeping in mind that the professional forecasters seem to miss turning points, even if their consensus forecasts are on average unbiased).
pat: I use two year annualized growth rates because the one year growth rates yield too many false positives and false negatives. There’s no deep theory to it. A more sophisticated analysis would assess different growth rates using probit regression.
Prof Chinn,
Thanks for the explanation. As for your chart, it reminds me of an Economist article in early 2001 (or very late 2000) about the frequency of the word “recession” in Nexus being way high then.