How does the term spread correlate with recession in other economies?
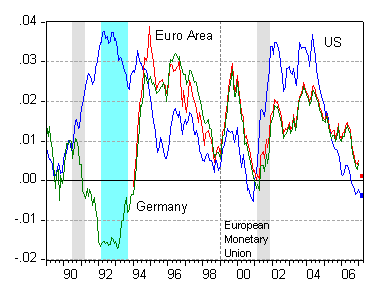
Figure 1 displays the familiar ten year-three month spread for the US with the gray shading denoting NBER-defined recessions. In addition I’ve plotted the euro area ten year-three month spread (where the ten year rate is a GDP-weighted average of harmonized ten year national yields), with the CEPR-defined recession in shaded light blue.

Figure 1: Ten year – three month term premium, daily averages. For US (blue), ten year rate is constant maturity, three month rate is for T-bills in secondary market; for Euro area (red), the ten year rate is the GDP-weighted rate of on-the-run benchmark bond yield, three month rate is for interbank money rate; for Germany (green), the short rate is the daily interbank rate. NBER recession dates shaded gray, CEPR recession dates (converted from quarterly dates) shaded light blue. Squares are data for March 9 (where Euro ten year rate proxied by arithmetic average of benchmark bid yields for Germany, France, Italy, Netherlands and Spain). Sources: St. Louis Fed FREDII; IMF, International Financial Statistics; Financial Times; NBER; CEPR; and author’s calculations.
The euro series do not extend back to 1989, but the German series, which is highly correlated with the euro area series with the overlapping period, does invert in 1991, before the Euro area recession (indicated in light blue).
The euro area yield curve again inverts in late 2000. While CEPR did not formally declare a European recession after the 2000 inversion, it did characterize the period after January 2001 through 2003 thus:
Based on currently available data, our current judgment is therefore that the euro area has been experiencing a prolonged pause in the growth of economic activity, rather than a full-fledged recession as we have defined it. The picture may of course change as revised GDP statistics appear.
And while the Euro area has not yet witnessed a yield curve inversion, it is coming closer.
What to take from this all? As we know, there is debate whether the old rules regarding the predictive power of the US term spread still apply (see Jim’s post on this subject). For the European experience, there is some evidence that it also has predictive power (see e.g., Moneta (2003)). (I didn’t examine Japan and the U.K., as the term spread in the former is unambiguously positive, while that in the latter does not appear to be a reliable predictor recessions (see the discussion here).)
Technorati Tags: recession,
yield curve,
euro area,
and
term spread.
The 1992 Bund inversion was also a divergence. Bund and Treasury curves looked quite different. Do we have a way of distinguishing between flattening in the Bund curve that is largely driven by flattening in the US and that which is domestically driven? To the extent $ and euro interest payments are substitutes, would not investors have reason to carry on a bit of arbitrage between the two markets, keeping curves similar except when there is a really strong divergence in market conditions, such as in the early 1990s?
kharris: There are ways of apportioning the amount of yield curve movements that are global and that are idiosyncratic. See for instance Diebold, et al. (2006)). But this won’t answer your question directly, I’m afraid.
In general, while we think arbitrage should keep the yield curves in tandem across countries, that ignores the wedge driven by expected exchange rate depreciation; in addition, even allowing for expected depreciation does not seem to explain divergences (to the extent we can measure expectations). This phenomenon is known as the failure for uncovered interest rate parity to hold (see this post).