The Bureau of Economic Analysis reported today that U.S. real GDP grew at an annual rate of 1.3% in the first quarter of 2007, moving our recession probability index up to 16.9%. This post provides some background on how that index is constructed and what the latest move up might signify.
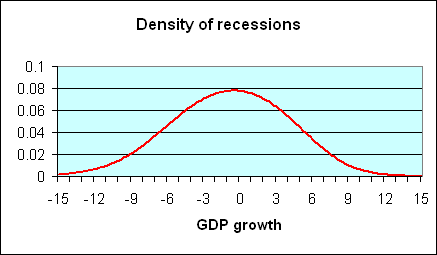
What sort of GDP growth do we typically see during a recession? It is easy enough to answer this question just by selecting those postwar quarters that the National Bureau of Economic Research (NBER) has determined were characterized by economic recession and summarizing the probability distribution of those quarters. A plot of this density, estimated using nonparametric kernel methods, is provided in the following figure; (figures here are similar to those in a paper I wrote with UC Riverside Professor Marcelle Chauvet, which appeared last year in Nonlinear Time Series Analysis of Business Cycles). The horizontal axis on this figure corresponds to a possible rate of GDP growth (quoted at an annual rate) for a given quarter, while the height of the curve on the vertical axis corresponds to the probability of observing GDP growth of that magnitude when the economy is in a recession. You can see from the graph that the quarters in which the NBER says that the U.S. was in a recession are often, though far from always, characterized by negative real GDP growth. Of the 45 quarters in which the NBER says the U.S. was in recession, 19 were actually characterized by at least some growth of real GDP.
|
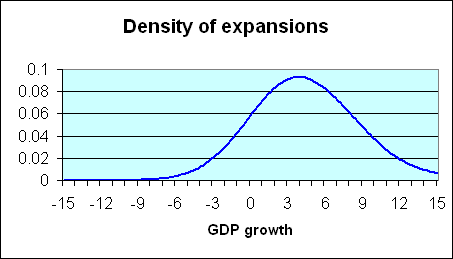
One can also calculate, as in the blue curve below, the corresponding characterization of expansion quarters. Again, these usually show positive GDP growth, though 10 of the postwar quarters that are characterized by NBER as part of an expansion exhibited negative real GDP growth.
|
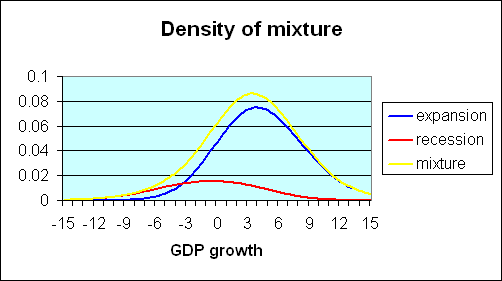
The observed data on GDP growth can be thought of as a mixture of these two distributions. Historically, about 20% of the postwar U.S. quarters are characterized as recession and 80% as expansion. If one multiplies the recession density in the first figure by 0.2, one arrives at the red curve in the figure below. Multiplying the expansion density (second figure above) by 0.8, one arrives at the blue curve in the figure below. If the two products (red and blue curves) are added together, the result is the overall density for GDP growth coming from the combined contribution of expansion and recession observations. This mixture is represented by the yellow curve in the figure below.
|
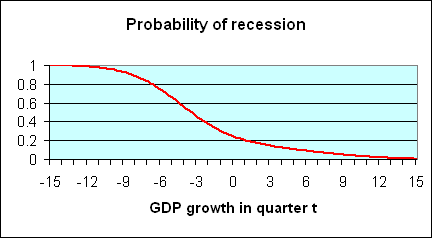
It is clear that if in a particular quarter one observes a very low value of GDP growth such as -6%, that suggests very strongly that the economy was in recession that quarter, because for such a value of GDP growth, the recession distribution (red curve)is the most important part of the mixture distribution (yellow curve). Likewise, a very high value such as +6% almost surely came from the contribution of expansions to the distribution. Intuitively, one would think that the ratio of the height of the recession contribution (the red curve) to the height of the mixture distribution (the yellow curve) corresponds to the probability that a quarter with that value of GDP growth would have been characterized by the NBER as being in a recession. Actually, this is not just intuitively sensible, it in fact turns out to be an exact application of Bayes’ Law. The height of the red curve measures the joint probability of observing GDP growth of a certain magnitude and the occurrence of a recession, whereas the height of the yellow curve measures the unconditional probability of observing the indicated level of GDP growth. The ratio between the two is therefore the conditional probability of a recession given an observed value of GDP growth. This ratio is plotted as the red curve in the figure below.
|
Such an inference strategy seems quite reasonable and robust, but unfortunately it is not particularly useful– for most of the values one would be interested in, the implication from Bayes’ Law is that it’s hard to say from just one quarter’s value for GDP growth what is going on. However, there is a second feature of recessions that is extremely useful to exploit– if the economy was in an expansion last quarter, there is a 95% chance it will continue to be in expansion this quarter, whereas if it was in a recession last quarter, there is a 75% chance the recession will persist this quarter. Thus suppose for example that we had observed -10% GDP growth last quarter, which would have convinced us that the economy was almost surely in a recession last quarter. Before we saw this quarter’s GDP number, we would have thought in that case that there’s a 0.75 probability of the recession continuing into the current quarter. In this situation, to use Bayes’ Law to form an inference about the current quarter given both the current and previous quarters’ GDP, we would weight the mixtures not by 0.2 and 0.8 (the unconditional probabilities of this quarter being in recession and expansion, respectively), but rather by magnitudes closer to 0.75 and 0.25 (the probabilities of being in recession this period conditional on being in recession the previous period). The ratio of the height of the resulting new red curve to the resulting new yellow curve could then be used to calculate the conditional probability of a recession in quarter t based on observations of the values of GDP for both quarters t and t – 1. Starting from a position of complete ignorance at the start of the sample, we could apply this method sequentially to each observation to form a guess about whether the economy was in a recession at each date given not just that quarter’s GDP growth, but all the data observed up to that point.
Once can also use the same principle, which again is nothing more than Bayes’ Law, working backwards in time– if this quarter we see GDP growth of -6%, that means we’re very likely in a recession this quarter, and given the persistence of recessions, that raises the likelihood that a recession actually began the period before. The farther back one looks in time, the better inference one can arrive at. Seeing this quarter’s GDP numbers helps me make a much better guess about whether the economy might have been in recession the previous quarter. We then work through the data iteratively in both directions– start with a state of complete ignorance about the sample, work through each date to form an inference about the current quarter given all the data up to that date, and then use the final value to work backwards to form an inference about each quarter based on GDP for the entire sample.
All this has been described here as if we took the properties of recessions and expansions as determined by the NBER as given. However, another thing one can do with this approach is to calculate the probability law for observed GDP growth itself, not conditioning at all on the NBER dates. Once we’ve done that calculation, we could infer the parameters such as how long recessions usually last and how severe they are in terms of GDP growth directly from GDP data alone, using the principle of maximum likelihood estimation. It is interesting that when we do this, we arrive at estimates of the parameters that are in fact very similar to the ones obtained using the NBER dates directly.
What’s the point of this, if all we do is use GDP to deduce what the NBER is eventually going to tell us anyway? The issue is that the NBER typically does not make its announcements until long after the fact. For example, the most recent release from the NBER Business Cycle Dating Committee was announced to the public in July 2003. Unfortunately, what the NBER announced in July 2003 was that the recession had actually ended in November 2001– they are telling us the situation 1-1/2 years after it has happened.
Waiting so long to make an announcement certainly has some benefits, allowing time for data to be revised and accumulating enough ex-post data to make the inference sufficiently accurate. However, my research with the algorithm sketched above suggests that it really performs quite satisfactorily if we just wait for one quarter’s worth of additional data. Thus, for example, with the advance 2007:Q1 GDP data just released, we form an inference about whether a recession might have started in 2006:Q4. The graph below shows how well this one-quarter-delayed inference would have performed historically. Shaded areas denote the dates of NBER recessions, which were not used in any way in constructing the index. Note moreover that this series is entirely real-time in construction– the value for any date is always based solely on information as it was reported in the advance GDP estimates available one quarter after the indicated date.
Although the sluggish GDP growth rates of the past year have produced quite an obvious move up the recession probability index, it is still far from the point at which we would conclude that a recession has likely started. At Econbrowser we will be following the procedure recommended in the research paper mentioned above— we will not declare that a recession has begun until the probability rises above 2/3. Once it begins, we will not declare it over until the probability falls back below 1/3.
So yes, the ongoing sluggish GDP growth has come to a point where we would worry about it, but no, it’s not at the point yet where we would say that a recession has likely begun.
There’s more on the new GDP numbers from Street Light, The Big Picture, William Polley, and SCSU Scholars.
Technorati Tags: GDP,
recession probability,
recession probability index
Recession probability index (P+C Chauvet and Hamilton)
Recession probability index, 1967-2007
Although the sluggish GDP growth rates of the past year have produced quite an obvious move up the recession probability index, it is still far from the point at which we would conclude that a recession has likely s
Professor Hamilton, you might be interested to know that Economic Cycle Research Institute (ECRI) correctly forecast each of the past three U.S. recessions months ahead of time and, just as importantly, they have never issued a false recession call.
Right now, they are not forecasting a recession which agrees with what you say. You can check out their website here:
http://www.businesscycle.com/
Good overview of the math outlined in your and Marcelle Chauvet’s paper – it looks like it might make for a really good background information section in a new forthcoming textbook?…
That speculation aside, as a heads up, at some point when I can get enough free time to work on it, I’d really love to get a copy of your spreadsheet with the historical data and calculations for generating the Recession Probability Index chart above. I think I may have finally figured out how to capture the historical series and to incorporate some “what if” elements that would make it a successful online tool.
Professor Hamilton it might be interesting to see an overlay of Recession Index with your classifications. In addition to shaded regions denoting the dates of NBER recessions, could you also add shaded regions as indicated by your classifications (“we will not declare that a recession has begun until the probability rises above 2/3. Once it begins, we will not declare it over until the probability falls back below 1/3.”).
Ironman, actually it’s programmed in GAUSS rather than a spreadsheet.
Abhilash, the information you’re asking for is in Table 4 on page 51 of our paper.
The fourth chart shows that if real GDP declines by 3%, the probability of a recession is only about 50%? This seems absurd to me. Perhaps I am misinterpreting the chart. But if real growth is 3% in a quarter, the probability that the quarter proceeding or the next quarter would have negative growth is only 50%?? Its got to be much higher than 50%!
Very nice explanation of your model, Professor. Thank you.
I look forward to poring over the March personal consumption details, to see how the 14 individual components came out, compared to January and February. I assume the BEA will have the database updated this weekend.
http://www.bea.gov/national/nipaweb/nipa_underlying/TableView.asp#Mid
Simple time-series model for projecting GDP growth:
Q4 ’06, 2.6%
Q1 ’07, 1.3%
–> Q2 ’07, 0%?
JDH, thanks as ever for the update. Should you feel like posting pseudocode, I wouldn’t stop you. We may not all have Gauss installed on our boxes, but most of us can download one or another free-software environment in which to play with data.
CS, not to offend, but blah, blah, ECRI, blah. Pointing me at them doesn’t help me do anything but, in the event that I happen to buy their spiel, give them money. I prefer to work through issues myself. Or do you have a paper of theirs you happen really to like? That could be useful.
touche, I don’t like to speak for others, but I think the point is that in any quarter in which GDP was -3% on an annualized basis, it may well have been low in the previous quarter, which ups the conditional probability for that, then-current, -3% quarter. Even the conditional estimates based on the advance GDP estimates gave some false alarms (I’ve been looking to the mid-’90s myself).
Just as an exercise in tea leaves reading, but is not the curve in the same level as in 1q2001?
Of the 8 times it has gone this high, only twice it has gone back down without hitting the ceiling…
Do we need to know this for the test?
Actually, I quite enjoyed the presentation.
Touche, in 1981:Q2, U.S. real GDP fell by 3.1%, yet NBER characterizes this as part of an expansion. Admittedly, -3.1% growth in expansion is a rare event, but a recession is also a rare event, and Bayes’ Law combines these two relevant facts in a way that is not always intuitively obvious.
The nonparametric estimates of the densities smudge these probabilities further. The parametric inference (which is employed in construction of the actual index) is a little sharper. The figure was used primarily to explain how the general idea works.
“In addition, we have also examined the performance of the model when a break in volatility in 1984 is taken into account. Kim and Nelson (1999b), McConnell and Perez-Quiros (2000), and Chauvet and Potter (2001) have found that the US economy became more stable since this date,
particularly the quarterly GDP series. When this feature is incorporated in the model the results
improve substantially with respect to the last two recessions, which took place after the structural
break in volatility. We have nevertheless chosen not to correct for the decrease in volatility in
the US economy in order to keep the analysis simple and robust.”
What would be your current prediction if you excluded data prior to 1984?
Thanks JDH, excellent explanation. Love those ex post fact graphs — sitting on the edge of my seat. I ditto the request for code but would like to see it as a CRAN module. I’m sure you could ‘talk’ one of your grad students into learning R (open source, blah blah).
ChrisA
I’m assuming the data used are the final quarterly growth rates, not the advance numbers.
It would be an interesting mind game to know how sensitive the 16.9% probability will be to a revision up or down in the Q1 value.
Or even more interesting – assuming the 1.3% rate holds for Q1, what Q2 rate would be needed to push the probability for Q2 above the 2/3 threshold for you to declare Q2 the start of a recession.
Touche, the quote you provide refers to the multivariate monthly model, not the quarterly GDP model used here. I don’t think there’s enough data using just quarterly GDP if you only start in 1985, and I haven’t tried the exercise you ask about.
dk, the data used in the estimation and inference at each date in the sample are the full vintage of data reported as of the quarter after that date.
For example, for the 16.9% number describing 2006:Q4, I have used all the GDP data now available, which includes the 2007:Q1 advance estimate, the 2006:Q4 data as reported on April 27, 2007, the 2006:Q3 data as reported on April 27, etc. The previous 9.1% reading for 2006:Q3 was based on all the data available as of Jan 31, 2007. This currently-available-vintage philosophy was used for every point in the graph above. Note that although the advance estimates are somewhat unreliable, the advance 2007:Q1 GDP numbers are only being used to refine the inference about 2006:Q4– the 16.9% probability refers to 2006:Q4.
I ran your (and Ironman’s) what if question, and found that if none of the current numbers get revised (fat chance of that!), GDP growth below -1% for the second quarter of 2007 would likely lead us to call a recession start for 2007:Q1.
wcw, ECRI was founded by Geoffrey H. Moore who was called the “father of leading economic indicators”. They have some books available:
http://www.businesscycle.com/resources/books/
Note that the third book here is also one of the references in the paper above by Professors Chauvet and Hamilton. ECRI also has some papers:
http://www.businesscycle.com/resources/papers/
How did you know it was the right time to cover your homebuilder shorts? That was great timing (and I am asking because I follow U.S. housing very closely to try to see if it will impact consumer spending).
“I ran your (and Ironman’s) what if question, and found that if none of the current numbers get revised (fat chance of that!), GDP growth below -1% for the second quarter of 2007 would likely lead us to call a recession start for 2007:Q1.”
Why are you losing time with a methodology that would make you call for a recesson in 2007:Q1 when you get the data for 2007:Q2, which is, like, in July 2007 or later?
Don’t you see the irony?
Anyway, given what’s happening to retail and auto sales in April, plus some growth that went from Q2 to Q1, the Recession should be starting about … now.
CS, thanks for the tip. I’ll check ’em out.
I didn’t “know”; I decided valuations were no longer far enough above my estimates for a short-sale comfort zone. I got lucky locally. Still, worth nothing that I was a month early. The RUF was in the low 25s when I covered, but spent early April in the 24s.
Incognitus, I just think you need the extra data to be confident in your call. It’s a very deliberate decision to wait until July to make the call for 2007:Q1.
JDH, thank you for following up!
GAUSS, huh? That would certainly make things more difficult for what I had in mind. It’s a shame that Aptech doesn’t appear to have done much in the way of developing web-based I/O for GAUSS’ applications – it would be cool if it would be possible to just put the recession probability index online directly!
There’s other development work I’ll need to do before I can really take on the challenge – if it pans out, I’ll be back in touch (probably months down the line. Barring shocks to the economy, I don’t believe the index would rise enough to become highly relevant to current events in that time.)
***
Incognitus, bear in mind that Professor Hamilton’s and Chauvet’s method would provide a confirmation of recession 12-18 months ahead of the NBER, even if delayed one quarter beyond the quarter for which the probability is calculated. That’s warp speed in comparison!