In previous posts I’ve discussed some of the estimates of aggregate trade elasticities. Some new work presented at a recent IMF conference on Chinese trade suggests that we may need to revise some of our views on the efficacy of yuan appreciation for inducing expenditure switching.
To place matters in context, recall in this post on the enigmatic yuan, I discussed the estimates provided by Marquez and Schindler [pdf]. The point estimate that they obtain is perverse for Chinese imports — that is imports fall in response to a yuan appreciation.
On a bilateral (US-China) basis, similarly odd results are obtained. Estimates by Mann and Plueck [pdf], Thorbecke [pdf] and Cheung, Chinn and Fujii are discussed in this post.
Some of the low price elasticities — especially for Chinese imports — were rationalized on the basis of the idea that domestic value added in Chinese exports was quite small. Brad Setser ([1], [2], and [3]) has taken issue with this view, characterizing it as outdated. The debate goes on, partly because empirical work on the issue is hampered by data limitations.
In one of the papers entitled “Measuring the Vertical Specialization in Chinese Trade” [pdf], presented at the conference, Judith Dean, K.C. Fung (a former colleague) and Zhi Wang write:
In recent years, two important related developments have transformed the nature of world trade: the explosive growth of Chinese trade, and the growth of vertically specialized trade due to international production fragmentation. The literature in each of these two separate topics is large and growing. However, very few papers quantitatively assess these two trends together. In this paper, we measure the degree to which Chinese trade has become vertically specialized, using a new measure adapted from Hummels, Ishii and Yi (2001). By making use of the latest Chinese input-output tables, and a new detailed Chinese trade data set which distinguishes
processing trade from other forms of trade, we develop a new method of identifying intermediate goods imported into China. With this new method, we measure Chinese vertical specialization over time, and by sector, export destination, and input source. We find about 35 percent of the value of China’s exports to the world is attributable to imported inputs. This vertical specialization exceeds 50% in some sectors, and is growing over time.
The authors conclude:
While trade fragmentation and China’s rapidly growing trade have been recognized as important economic phenomena, the importance of fragmentation in China’s trade growth has been
left unexamined until recently. In this paper, we provide the most up-to-date and comprehensive measures of the degree of vertical specialization in China’s trade, using a new detailed Chinese
dataset which allows us to distinguish processing imports and exports from ordinary trade. We further utilize the United Nations Broad Economic Categories (BEC) system to identify nonprocessed
imported intermediates from imports of final goods These data are incorporated into the Hummels, et al. (2001) measure of vertical specialization, using both the 1997 and 2002 benchmark
Chinese IO tables. We then quantify vertical specialization over time, by source, by trading partner, sector, and type of firm.
Our results show that the vertical specialization in China’s exports to the world was more than 30% in 2002. In the sectors with the most fragmented trade–plastic products, steel processing, communication equipment, industrial machinery, metal products and computers—vertical
specialization exceeded 50%. Not surprisingly, the firms with the most fragmented trade are the foreign-invested enterprises. There is strong evidence of the importance and persistence of an Asian
supplier network to China. About 58% China’s aggregate vertical specialization in 2002 was attributable to imports from Japan, Taiwan, South Korea and other Southeast Asian economies. Among bilateral partners, China’s vertical specialization was high (about 30%) with not only the US, the EU 15, and Canada, but also with Taiwan and Singapore. Our evidence also suggests that the
fragmentation in China’s global trade is growing, particularly its trade with the US and the EU.
Our results are generally robust to the use of alternative methods of measurement. However, for some specific sectors, there can be some variations across methods. For example, in 1997, for motor vehicles, the extent of fragmentation was 34% using our own DFW method, but it was 31.9% using the BEC method and 35% using the IO approach. These variations could become important for our future work since we intend to econometrically determine the how the VS shares can vary with
different variables as suggested in the theoretically literature. The alternative measures give us an opportunity to test the robustness of our future estimates.
Figure 5 from the paper exhibits the degree of vertical specialization by industry. No surpise that the highest degree of vertical specialization is in plastic products, communication equipment and electronic computers. Still, even in that last category, domestic value added is almost one-half.
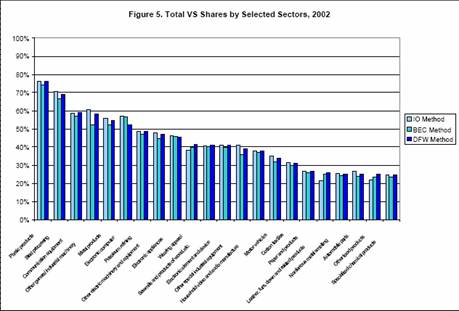
Figure 5 from J. Dean, K.C. Fung, and Z. Wang, 2007, “Measuring the Vertical Specialization in Chinese Trade” [pdf].
The authors provide broad trends up to 2005; it is interesting that they assert that vertical specialization is increasing, although at a decelerating rate. This is shown in Figure 7 from the paper.
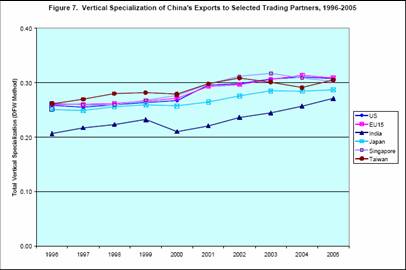
Figure 7 from J. Dean, K.C. Fung, and Z. Wang, 2007, “Measuring the Vertical Specialization in Chinese Trade” [pdf].
What are the key implications, from the perspective of global adjustment? There are two. First, the relatively small price elasticities estimated for Chinese exports are consistent with a high degree of vertical specialization. Second, the considerable extent of Chinese value added in many of the categories of Chinese exports provides some scope for expenditure switching by yuan appreciation (although the impact on US-China bilateral trade would likely be fairly minor, for the reasons I’ve given before.)
Another paper presented at the conference had a slightly different message. From the abstract of Li Cui and Murtaza Syed, 2007, “Is China Changing It’s Stripes? The Shifting Structure of China’s External Trade and its Implications”
[pdf]:
Using disaggregated trade data, this paper assesses how the expansion of China’s production capacity and its changing production structure may be affecting its trade linkages with other countries. It argues that although processing trade still accounts for an important share of its total trade, China has moved away from traditional assembly operations and its exports have started to rely more on domestically sourced components, particularly in less sophisticated product categories. As a result, China’s imports and exports have to a large extent delinked in recent times, with imports of parts and components increasingly driven by domestic production needs rather than final demand abroad. This increased domestic sourcing may be one of the important factors behind the recent increase in China’s trade balance. In addition, as China moves up the value chain, both its imports and exports have become more sophisticated than in the past. This shift in the product composition of China’s trade bundle
could imply that its trade balance has become more sensitive to demand changes in foreign markets and to relative price changes. Indeed, the empirical results suggest that China is becoming more exposed to fluctuations in the strength of the global economy, and that changes in its exchange rate could have a bigger impact on the trade balance and the domestic economy than commonly believed. The paper also discusses some potential implications that this shift in China’s trade and production structure is likely to have for other
economies in the region, as well as for the world.
Since the posted paper is preliminary, I won’t quote further. I will note that the results pertain to only a subset of Chinese manufactures, in so far as the methodology requires matching specific imported inputs to specific outputs in the SITC system.
The bottom line is great for academics. More research needs to be done!
Technorati Tags: China, imports,
exports,
US-China trade deficit,
renminbi,
exchange rate,
vertical specialization, value added, and
expenditure switching,
Menzie: Interesting stuff. This then raises a further question: given these reasons to expect that China’s export elasticities wrt the exchange rate are quite low, then why are the Chinese authorities so reluctant to let the yuan appreciate? Perhaps this can be construed as roundabout evidence that the PBoC’s main concern is with possible balance sheet effects of a faster revaluation.
Kash Mansori, the unemployment in China is much higher than what the official statistics say, so I would guess that China has been reluctant to let the RMB appreciate because they were fearful of doing anything that might hurt the labor-intensive exports sector. It is only recently from the work above that we see China’s export elasticities wrt the exchange rate are low.
Right now China is having trouble with too much liquidity and rising inflation so letting the RMB appreciate should help in this regard.
Kash — the problem with the “balance sheet” argument is that most Chinese bank lending is in RMB, and most investment is either financed out of retained earnings or domestic RMB loans, so there isn’t an obvious balance sheet mismatch in the banking sector(apart from financing an export biz with rmb, but the concern there is pretty close to a concern about the export sector). The banks do have some $ capital from the recap, but that supposedly is currency hedged via swaps with the PBoC.
In any case, the classic balance sheet mismatch – borrowing in $ for domestic investment — isn’t a concern if the $ depreciates. The most obvious balance sheet that would be hurt by faster RMB appreciation is not the balance sheet of dolalr borrowers, but rather the balance sheet of big holders of dollar assets — i.e. the PBoC. and my understanding of the domestic politics is that the PBoC wants more, not less, RMB movement.
I suspect the Chinese are concerned about the impact of any RMB appreciation on the labor intensive textile sector, and to a degree, think policy has been captured by export interest. but we all have our preferred explanation for China’s reluctance to move.
Menzie — does the dean fung and wang estimate of 35% value added work off data through 2005, or does the data set end a bit earlier? And is there any trend in the data? The big disconnect between import and export data only really started in 2005 (and it then became very noticeable in 06) so one potential way of reconciling cui and syed with dean fung and wang is that they are talking about different points in time … i unfortunately am not able to download and read the papers, so i cannot easily check myself, and the quote from dean wang and fung (which talked of 02 — back when China exported about 1/3 what it does now) seemed a bit at odds with the later discussion which indicated the analysis extended through 05.
Kash Mansori: I pondered the exact question you posed in this post. I suspect they must value foreign driven aggregate demand more than domestic.
brad setser: The more disaggregate results are based upon benchmark data in the input-output tables for 1997 and 2002. For the less disaggregate estimates, they use data on Chinese trade up to 2005.
Kash Mansori,
The implication of your post is that a change in the relative exchange values between the yuan and dollar would work some kind of magic. I realize that this is an a priori assumption by most who post here but some of us realize that changes in the monetary standard only hinder production and ultimately destroy wealth.
The Chinese on the whole understand this and so continue to link the yuan to the dollar so that trade is not effected by the exchange rate. There is no need for the Chinese to change their exchange rate. It would only hurt their economy. The US is supporting such action in an attempt to limit the output of the Chinese economy. It is the Kennedy inverse, a lowering tide sinks all ships.
I don’t think data through 2002 is going to convince me. so much has changed since then (scale of china’s exports, scale of the CAS, trend rmb appreciation b/c of trend $ appreciation becomes a depreciation) … the big growth in Chinese value added seems to have occurred well after that. up til 2002 (or a bit later), the story of China importing sophisticated electronic parts for final assembly really does fit. after say 2004, my guess (based on the various data the imf and others have looked at, as well as the rise in CHina’s global surplus even as its commodity import bill soared) is that the pattern changed a bit …