The April trade release surprised on the upside. Here are a few other insights, not all of which are unalloyed positives.
From Bloomberg:
U.S. Economy: Trade Gap Narrows More Than Forecast (Update1)
By Courtney Schlisserman
June 8 (Bloomberg) — The U.S. trade deficit narrowed more than forecast in April as a weaker dollar pushed exports to a record and demand for imports waned.
The deficit fell 6.2 percent, the most in six months, to $58.5 billion, from a revised $62.4 billion in March, the Commerce Department said today in Washington. The gap declined even as the shortfall with China widened.
The dollar’s drop and expanding economies in Europe and Asia are fueling demand for American-made goods and the deficit is retreating from a record $67.6 billion in August. The gain in exports may also help economic growth accelerate after the slowest quarter in more than four years.
“The trade imbalance seems to be permanently on the mend,” said Chris Rupkey, chief financial economist at Bank of Tokyo-Mitsubishi UFJ Ltd. in New York. “Certainly, trade is going to contribute to growth in the second quarter.”
Rupkey predicted a deficit of $60.2 billion, the lowest among 74 economists surveyed by Bloomberg News before the report was published.
In April, exports rose 0.2 percent to a record $129.5 billion, as sales of foods, plastics and consumer goods such as jewelry improved. Imports slipped 1.9 percent.
“The rest of the world is growing,” said Diane Swonk, chief economist at Mesirow Financial Inc. in Chicago. “With the tailwind of a weak dollar, that’s good news to keep our factories humming. This will probably easily throw GDP growth over the 3 percent range for the second quarter.”
Faster Growth
An improvement in the trade deficit is one reason why economists project growth will accelerate to a 2.6 percent annual pace this quarter, according to the median estimate of economists surveyed this month by Bloomberg News.
Economists at Morgan Stanley raised their second-quarter forecast for gross domestic product to 4.1 percent from an estimate of 3.6 percent prior to the report. Banc of America Securities LLC said in a note to clients that the figures imply a growth rate of about 3.5 percent, compared with a previous prediction of 2.5 percent.
Economies overseas are faring better. Gross domestic product in the 13 countries that use the euro rose 3 percent in the year ended March, compared with 1.9 percent in the U.S.
A weaker dollar, which makes American goods cheaper abroad, is also boosting exports. The dollar is down 6.4 percent since the beginning of last year against a trade-weighted basket of currencies of major U.S. trading partners.
GDP Calculation
Adjusted for changes in prices, figures the government uses in its calculation of gross domestic product, the U.S. trade deficit dropped in April to $54.9 billion, the lowest since September 2004, from $59.6 billion.
Demand for consumer goods from abroad slumped to $38.9 billion, from March’s $40.4 billion. Eighty percent of the drop reflected a decrease in pharmaceuticals, a category that economists say has shown much volatility in the last few months.
Oil imports fell to $24.9 billion, from $25 billion a month earlier, as a drop in volume offset higher prices.
The cost of imported oil rose to $57.28 a barrel, the highest since September. Oil imports probably will remain elevated, economists said.
U.S. crude oil imports increased 2.22 percent last week, the Department of Energy reported on June 6. Imports have increased six of the last eight weeks.
Figure 1 places this release in perspective. The bounce back is noticeable even when placed in the context of the zero line.
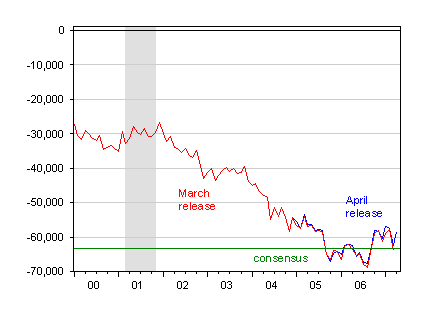
Figure 1: Trade Balance, April (blue) and March (red), in millions of dollars per month, seasonally adjusted, and Bloomberg consensus (green). Source: BEA/Census June 8th trade release; Bloomberg.com.
Some of the discussion attributed the improvement to the weakening dollar. Now, by eyeballing, one could make that argument. But the lags have been sufficiently long and variable that I don’t know how that make the attribution to dollar weakness versus other factors. See Figure 2.
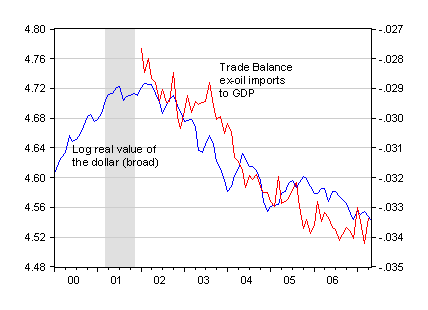
Figure 2: Log real value of the dollar against a broad basket of currencies (blue), and trade balance ex-oil imports, in millions of dollars per month, seasonally adjusted (red). Quarterly GDP converted to monthly by quadratic average match; April 2007 GDP assumes nominal 3.5% growth. Source: BEA/Census June 8th trade release, Federal Reserve, and author’s calculations.
The trade release itself makes note that there is a revision of previous data. The revision is not insubstantial, and has some implication for GDP going back (although $7 billion revision for all of 2006 doesn’t seem like it would have such a large impact). But the overall level of the trade balance is shifted up by the revisions, as shown in Figure 3.
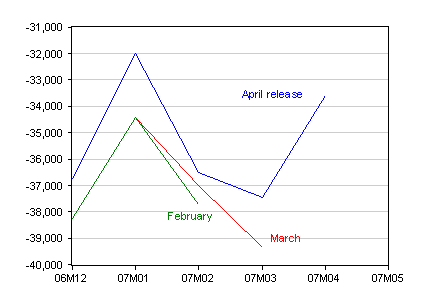
Figure 3: Trade Balance ex. oil imports, April (blue), March (red), and February (green) in millions of dollars per month, seasonally adjusted. Source: BEA/Census June 8th trade release.
Interestingly, real imports of petroleum and petroleum related products seems to be running a little below previous years. I’ve plotted the 3 month trailing moving average of real imports in Figure 4.
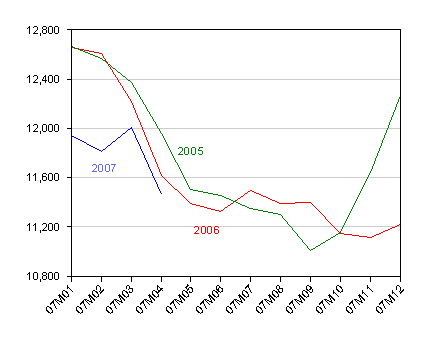
Figure 4: Three month trailing moving average of real oil imports, in 2007(blue), 2006 (red), and 2005 (green) in millions chained $2000 per month, seasonally adjusted. Source: BEA/Census June 8th trade release.
I suspect — but haven’t checked — that this is not due to a resurgence in domestic oil production, but rather a decline in overall demand.
Now, given my previous research on capital goods flows and the relation to capital investment, I wonder about what the pattern in exports and imports of capital goods means.
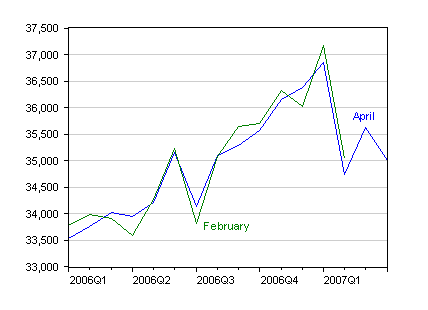
Figure 5: Real exports of capital goods, April (blue) and February (green), in millions of dollars per month, seasonally adjusted. Source: BEA/Census June 8th trade release.
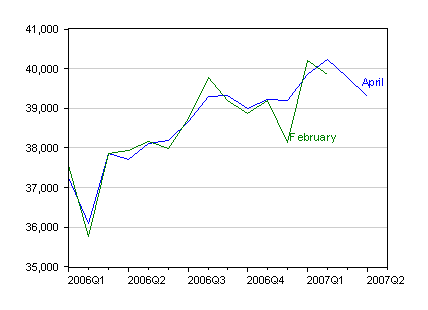
Figure 6: Real imports of capital goods, April (blue) and February (green), in millions of dollars per month, seasonally adjusted. Source: BEA/Census June 8th trade release.
Real capital goods exports dove from their January 2007 peak, and are now bumping around $35.25 billion per month. This outcome extends the mystery of why fast growth — and rising investment — around the world hasn’t manifested itself in faster US capital goods export growth. Real imports, which in the last recession were highly correlated with equipment investment, seems to be declining from something of a (flat) peak. So, going on history (but no econometrics), no big surge in equipment and software investment yet…
Additional discussion at Calculated Risk and Brusca at Haver.com.
Technorati Tags: imports,
trade deficit,
exports,
oil imports,
capital goods,
GDP.
Nice dissection of the data, Professor. Ominous, that peak and fall in real capital goods imports and exports.
With the weak same store sales for May and weak pending home sales for April (signaling weak closings for May), I vote that you and Professor H- beat the crowd and turn the emoticon to a frown, now!
The Brusca link also goes to calculated risk.
It looks to me like the trade improvement is all from imports and this just reflects the slow down in domestic consumption growth and the inventory correction. The y/y growth in real nonpetroleum imports has slowed from double digit levels in 2003-2004 to about 3% now.
If the economy is strengthening imports should also rebound.
Aren’t we just getting another example of the point that about the only way to improve the US trade deficit is to kill demand growth.
Can you show a longer history of the comparison of the broad dollar to the trade balance.
jg: Thanks for the compliment. I leave the tasks requiring courage (i.e., forecasting) to Jim.
Spencer: Thanks — the link is fixed. Good point. Although the three month change shows an acceleration of imports as exports have tailed off. In log terms, real goods exports have grown an annualized -0.4 percent, and non-oil imports by 6 percent.
A longer history of the real exchange rate and trade balance (on a NIPA basis) is shown in this post: “More on Real Exchange Rate Changes and Trade Adjustment” (May 28).
I really enjoy this sort of analysis versus the impossibly shallow reports from the media. I concur with Spencer. It seems laughable that people think that we can export our way out of this situation. More to the point, I have long believed that our “service based” economy is simply based on too many non-tradeable services which is going to make this a VERY painful experience.
My small US firm manages a commodity investment fund and we have many non-US clients. We were never surveyed about our contribution to the trade balance. Are financial services exports, like ours, included in the data? If so, how? Somebody just makes a guess?
Does anyone find it curious that imports fall when growth declines? From GB in the 1800s to the US in the 21st Century a more prosperous nation imports more than it exports. Those who see a fall in imports as a positive should walk cautiously.