Long term yields have jumped up, as Jim noted. The spread between the 10 year and 3 month interest rate has moved positive.
This outcome is illustrated in Figure 1. The red square shows data for 6/27.
Figure 1: Ten year-three month spread, in percentage points, monthly average of daily data (blue line), and spread as of 6/27/07 (red square). NBER recession dates shaded gray. Source: St. Louis FRED II, NBER, and author’s calculations.
Is the threat of recession over? As highlighted by the placement of the NBER-defined recessions (shaded gray), slowdowns typically come after the spread reattains a positive value.
More caution should be drawn from the entire maturity spectrum. The June 29th yield curve (green, below) shows that — if the risk-neutral expectations hypothesis of the term spread is taken at face value — rates between 6 months from now and 2 years from now will lower than 6 months from now.
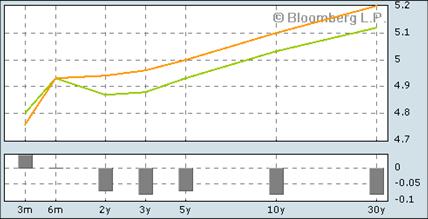
Figure 2: Yield curve, Green (6/29), Orange (6/28). Source: Bloomberg, accessed on 6/29/07.
Technorati Tags: recession,
yield curve.
Opening Bell: 7.3.07
Kraft offers €5.3bn for Danone’s biscuits (Times Online) If there’s something a little dirty sounding in this article, don’t worry, it’s all good. Kraft is looking to up its investment in the cracker and cookie market, as its offered to…