Forward rates on Treasury bonds tell an interesting story about the market’s reaction to the Fed’s interest rate cut on Tuesday.
A forward rate is sometimes a useful way to summarize the information in the term structure of interest rates. Suppose for example that today you sell a 5-year zero-coupon bond currently worth $1000, and simultaneously buy a 10-year zero-coupon bond that is also currently worth $1000. You then wouldn’t have any net cash flows in or out for 5 years, at which point you’d have to pay back the redemption value on your 5-year bond. Five years after that, you’d collect the redemption value on your 10-year bond. In effect, you’d have entered into an agreement today to buy a 5-year bond 5 years from now. The interest rate on that future bond is something you could calculate today from the current 5-year and 10-year yields to maturity, and is known as the 5-year, 5-year forward rate.
One could calculate such a forward rate using either the usual nominal Treasury bonds, or using Treasury Inflation-Protected Securities, whose coupon and principal are both indexed to increase with whatever inflation (as measured by the headline consumer price index) actually turns out to be each year in the future. The difference between those two forward rates (the nominal forward rate minus the inflation-protected forward rate) is described as the forward “inflation compensation” or “break-even inflation” rate, and might be interpreted as the inflation rate that market participants anticipate to hold in the future. This forward inflation compensation was studied in a recent research paper by Refet Gurkaynak, Andrew Levin and Eric Swanson, who found that the far-forward inflation compensation reacts much more to economic news in the United States than in Sweden, where the central bank has credible inflation targeting. For the United Kingdom they found that the sensitivity of the far-forward inflation compensation to economic news fell significantly when that country moved to inflation targeting.
A reader sends me this rather striking graph (a Bloomberg screen save from Tuesday’s U.S. markets) of the 5-year, 5-year forward inflation compensation. As the news arrived that the Fed was cutting its target for the fed funds rate, this measure of expected future inflation moved rather dramatically.
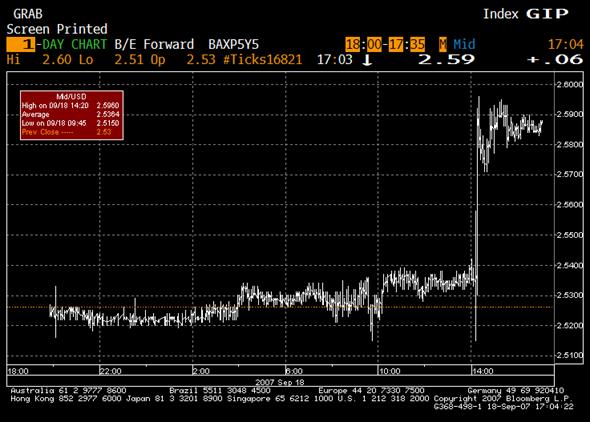
Although the abruptness of the adjustment is impressive, we need to remember the scale– we’re only talking about a 5-basis-point change (or 0.05%) as we move up that cliff. Specifically, people who were betting that we’d see a 2.53% average annual rate of increase of the CPI between 2012 and 2017 are now anticipating something like a 2.58% average annual rate of increase over those 5 years.
Small, but a suggestion that this aspect of the Fed’s decision this week could be with us for a long time.
Technorati Tags: macroeconomics,
Bernanke,
Federal Reserve,
inflation,
yield curve,
economics,
foward rates
The action in the Treasury market (most particularly in 5+ year products), in crude, in foods, and in metals confirms the action in most currencies. We are off on another wild liquidity ride.
And, golly gee gosh golly, just when you thought that the “American people” were simply not saving enough (or actually dissaving), here comes the Fed to say, with its new incentivizations (the beginning of a dramatic reduction in rates), “er, you are actually saving far too much … save LESS.”)
The central bank of the USA is a one trick pony where the one trick is the creation of inflation.
The blowback in the hereinabove mentioned markets is not unexpected and is only in its infancy.
Here we go again. Again.
Will it really be unexpected when BB puts out a pitch for adjustable-rate mortgages in a few months?
If long rates rise sufficiently that will be his next (and only) hope to get housing prices inflating again. Save less, borrow short, buy houses.
Sigh.
Quantitatively, one can obtain a much more accurate prediction of inflation when uses labor force projection for inflation estimates. At a 10-year horizon, the years between 1965 and 1995 are much better predicted when following this procedutre than any other:
http://inflationusa.blogspot.com/2007/08/can-we-predict-inflation-and.html
Now that you’ve whetted our appetite, could you suggest how those of us without the budget to pay for a proprietary function on a Bloomberg terminal might recreate that analysis?
Beyond that, I think the Fed must enjoy fairly good credibility as an inflation-fighting central bank, in the absolute sense if not in relation to the BoE, given that a 50 bp ease generated only a 5 bp rise in inflation expectations in the 5-10 year window.
Anonymous, I don’t have a subscription either, and count on the largesse of Econbrowser readers to send me neat graphs like this one. Although I haven’t done the calculations myself, I believe you would apply equation (3.2) in the Gurkaynak-Levin-Swanson paper to 5- and 10-year constant maturity Treasury yields, which can be found at FRED.
And on your second point, Anonymous, any part of that 50-basis-point cut that was anticipated beforehand would have already been priced into the yields and would not have contributed to the change that was seen on release of the news. My estimate is that it was actually only a 15-basis-point cut relative to the expectation, so the impact multiplier is closer to 1/3 than your 1/10.
You’re not being precise..
Not sure what it means to say the market was pricing in only a 15 basis point cut relative to expectation.. in the context of a chart of 5/5year fwd something’s…..I’ll take your word that it has something to do with inflation..
But the market’s expectations is a vector..
what it expects at say the FOMC meetting.. then contingent upon that what it expects at the next. and the next and the next..
You have instruments that reflect all those expectations trading simultaneously..
Prior to the FOMC.. if there was going to be a 50 basis point cut.. the market was pricing on a forward basis.. that there would be another cut in October maybe of 50 basis points.. and contingent on that another in December…
Today for better or worse.. after the realization of the 50 basis point cut.. plus the FED’s language.. the subjective probability of just another 25 basis point cut at the October meeting is around 50% .. and given October.. one way or the other around 50% in December..
So in expectations where as 50 basis points of ease was expected to “assure 100 basis points:
Now its a question whether its just 1 and done or not..
Whatever those squiggles mean on the Bloomberg chart this is the narrative story behind the numbers..
Looks like horizontal scale in hours.
Given the cash flows that determine this graph, how much money in actual transactions determined this projection of inflation 5 years hence?
Given that these are long bonds, serious holders hold them and much of the market transactions are churn and/or speculation.
In other words, only a small percentage of market participants for long Treasuries moved the market over this 90 minute period.
Watching traffic on such sites as Seniorresource.com it is clear that those on fixed incomes have been in troble for some time. This administration only cares about oil people
Given that long rates jump occasionally only drift lower in time, can we really say this is anything but the knee jerk reaction with little predictive property?
well i like it better than the 30 yr or 10 yr as a measure for inflation expectations. those markets are skewed by all kinds of noninflation related purchases/sales.
the difference on the difference seems more accurate
The change from 2.53% to 2.58% is not 0.05%, it’s actually 2%. You should have just stuck with the 0.05 percentage point.
Dave, I don’t think it’s usually helpful to take a percent of a percent (e.g., 0.05 as a percent of 2.53). You’re right, basis points are always the clearest units. I just wanted to remind people that 5 basis points isn’t a whole lot.
In my studies I’ve found that lots of my profs (who are Canadian) only speak of the Fed with disdain for their ineffectiveness compared to the BoE or BoC. It makes me more interested in the point made about inflation targeting. Since the Fed is trying t control 2 variables (inflation and unemployment) with only one ‘tool’ (the Fed Rate) it cannot be readily effective at both. No other major central bank has a focus on unemployment, why does the Fed?
For one thing, Michael, the Fed is required by law to do so.
You have one data point every six months from the single monopoly player in banking vs 30 million non-monopoly buyers of banking. You are going to have the herding effect, cannot avoid it.
What the chart shows is that we will continue a banking cycle, as usual and unavoidable. We need competative monetary services.
For the reader who provided professor Hamilton the chart, can you send along a 5 year version of the same?