Some delayed reflections on exchange rates, trade prices, and the messages from the August data.
This post is prompted by one reader’s query whether the import price release was bullish or bearish. I still don’t have an answer to that question, but it does strike me that this is a good time to re-evaluate what is going on with import and export prices, and what that implies.
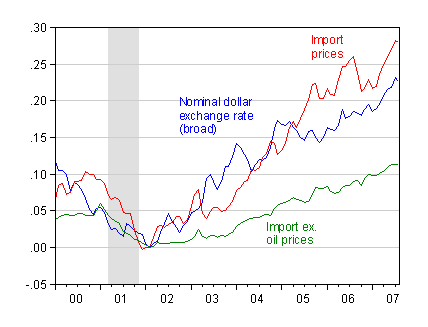
First, the oft-noted relation between import prices and the broad trade weighted exchange rate (in logs, normalized to 0 in 2002M02). Notice that total import prices have risen faster than the dollar exchange rate. However, to some extent this is not the relevant comparison since total import prices are substantially affected by petroleum and petroleum product prices, which have a substantial exogenous (with respect to the exchange rate) component. (Of course, as Brad Setser has recently pointed out, it’s not totally exogenous — when the dollar weakens, the dollar price of oil will tend to rise, to the extent that the relative price of oil is the fundamental equilibrium price.)

Figure 1: Log nominal dollar exchange rate (blue), goods import prices (red), non-oil goods import prices (green), normalized to zero in 2002M02. NBER Recession Dates shaded gray. Source: Federal Reserve Board via FREDII, BLS, and author’s calculations.
Notice that import prices have risen by about 11.2% relative to the 2002M02 value, while the dollar has fallen by about 22.6%, suggesting — if everything else were held constant — exchange rate pass through of about one half. However, not all else is held constant (this is why people do econometrics — see the estimates in the 0.25 range cited in this post).
One observation is that prices overall are jointly determined with the exchange rate, so import prices and exchange rates are responding to monetary policy and other shocks. So rising import prices might be inflationary to the extent that those movements reflect exogenous exchange rate changes.
A second observation is that to the extent that trade prices reflect the impact of exogenous exchange rate changes, there is no reason to look at only import prices. Rising export prices — to the extent that exportables are somewhat substitutable for goods in the home consumer bundle — can also introduce inflationary pressures.

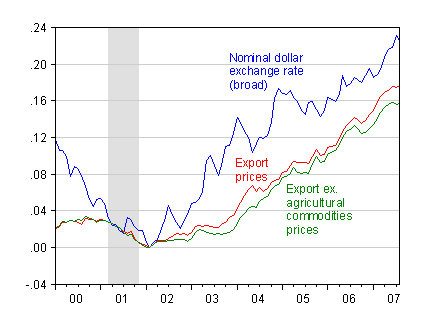
Figure 2: Log nominal dollar exchange rate (blue), goods export prices (red), non-agricultural goods export prices (green), normalized to zero in 2002M02. NBER Recession Dates shaded gray. Source: Federal Reserve Board via FREDII, BLS, and author’s calculations.
Figure 2 indicates a 15.7% ex-agricultural commodities export price increase, so that a naive reading of exchange rate pass through is on the order of 69%.
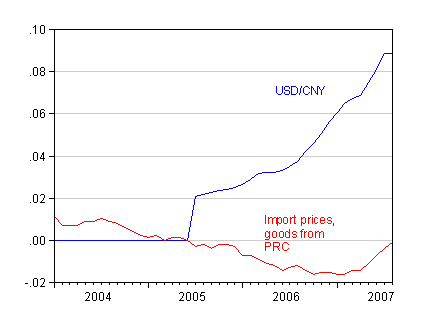
A third observation (not new, see WSJ Real Time Economics) is that prices of US imports from China have finally started moving up. The fact that the Chinese yuan’s value rose for almost two years before import prices began to rise highlights several points.

Figure 3: Log nominal USD/CNY exchange rate (blue), and prices of US imports from China (red), normalized to zero in 2005M06. Source: Federal Reserve Board via FREDII, BLS, and author’s calculations.
First, sometimes it is important to consider the cost of production (that is, the price of imports is a function of both the exchange rate and the cost of production, determined in part by labor productivity). Second, to the extent that imports of intermediate goods into China are likely to have been invoiced in dollars, the impact of USD/CNY movements on prices of Chinese exports to the US is likely to have been fairly muted (the issue of vertical specialization and the impact of dollar depreciation is covered here: [1], [2]). In other words, it’s unclear exactly how much of the rise in import prices from China is due to exchange rate movements and how much is due to rising Chinese inflation.
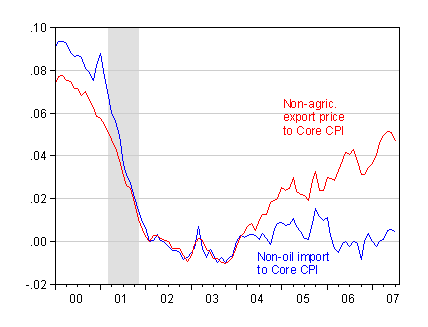
The last observation is that rising tradables prices might not be indicative of inflationary pressures. Rather, if overall monetary policy is non-accomodative, these price changes might be just a reflection of rising overall price levels, or alternatively a relative price change (this is the expenditure switching mechanism I’ve mentioned here). I plotted the non-oil import and non-ag export price indices relative to the non-energy non-food CPI.

Figure 4: Log non-oil goods import prices to core CPI ratio (blue), and non-agricultural goods export prices to core CPI ratio (red), normalized to zero in 2002M02. NBER Recession Dates shaded gray. Source: Federal Reserve Board via FREDII, BLS, and author’s calculations.
The graph illustrates the fact the relative price of traded goods fell substantially in the lead up to the dollar peak in February 2002. The surprising finding is that while relative export prices have risen (although nowhere near where they were before), relative (non-oil) import prices have barely budged. Given this fact, the improvement in the non-oil trade balance is somewhat surprising only if one does not take into account the slowdown in US economic activity. This pattern of relative prices suggests to me that the improvement in the trade balance that has occurred thus far owes little to import reduction due to higher import prices.
Technorati Tags: href=”http://www.technorati.com/tags/dollar”>dollar,
exchange rate,
pass through,
import prices,
monetary policy, inflation.
Why not just do a multifactorial regression analysis, perhaps focusing on the post 2001 data( since there may be a mechanistic change indicated by the inflection point in three of the graphs)?
It seems to me that the first graph makes a strong case that the strength of the dollar is strongly correlated to oil prices; in the fourth graph, there’s a suggestion that oil is a primary driver of inflation (since so many other factors are excluded).
The second graph seems to show that dollar devaluation works its way to export prices (most of which have some component of oil prices, if only transportation). The third graph shows that Chinese imports have a minor contribution to import prices and can be neglected as an independent factor. The fourth graph shows that non-agricultural exports have become the primary factor in core CPI.
So, the hypothesis is that the strength of the dollar is a function of oil prices, CPI, and export prices, with the likelihood that there’s some correlation between variables, and therefore probably a need to orthogonalize the regression variables (by, for example, using core CPI to knock out the correlation between non-core and oil prices).
Am I understanding the framing of the question correctly?
Sorry if this is an obvious question but in your last point, are you saying that the reason the trade balance has improved is solely because of the slowdown in economic activity? From your last chart it would seem that the trade balance would be getting worse. So for the trade balance to actually improve there would have to be a major economic slowdown occurring to outweigh the effects of the current pricing environment?
charles: I could use regression analysis, but you’d be surprised how difficult it is to obtain an acceptable specification that passes the usual time series diagnostics, and takes into account issues of integration, cointegration and structural breaks (not to mention endogeneity). So I went for the discursive approach.
For econometric studies that address these issues, but not in real time, see Doomed to Deficits and Supply capacity…. I haven’t published any pass through studies, but you will see the relevant academic papers hyperlinked in this post, as well as this earlier post, which does contain some regression analysis.
Jim L: Sorry to be unclear. Relative export prices are rising, and export quanta are increasing, so the trade balance is improving partly due to that effect (i.e., income effect on the export side).
If you were intending this for publication in a peer-reviewed journal, I could see the issues you raise as critical, Menzie. But when it’s just you, me, and the barflies trying to understand what factors are most likely to be important in exchange rates, I see less of a problem.
I will read the links you’ve provided in more detail as I’m able, but a quick look doesn’t seem to contradict my perception that multifactorial regression is the easier way to formulate a hypothesis. While there are many problems when applying it to organic systems, systems that change over time, large data sets provide very high power. In practice, that means that nonlinearities and lags are swamped by the sheer number of data points.
It should not, of course, be used for extrapolation. In careless hands, it is famous for producing nonsense. But that’s true of all model-building. When one is in the stage of hammering out a general model, multifactorial regression allows one to quickly see which variables appear to be related so that one can avoid issues of multicollinearity, which is, IMO, a more serious problem in variable selection.
Anyway, thanks for your analysis. However you choose to attack the problem, it is of help to me in understanding this issue.
Charles: The problem is not the mechanical running of the regression; it’s data (and time). In order to do some of the regressions, one has to track down and update the data (which I do on my own — no research assistants here!). And sometimes that data is not believable or available (I’d love a monthly unit labor cost series for Chinese manufacturing — I will take donations!). Finally, even getting an acceptable regression fit for non-peer review circulation takes time — but in the future I will perhaps accept the challenge.
Understood about the quality of data series, Menzie. Even there, the power of data with more than, say, 50 data points/variable, tends to overwhelm such imperfections. Monthly Chinese labor manufacturing costs…eh… maybe not.
If you’re using only the best software, here’s a time saver you may have overlooked. For reasonably small data sets, say, less than 500 data points per variable, one can do the analysis in Excel with a simple highlight/analyze– one of the few Microsoft features that works well. Unlike some of the fancier statistics packages, operation is intuitive. It does require equal numbers of data points/variable, though, and doesn’t deal with complex design.
The again, I’m not sure I deal with complex design either.
Thanks for considering taking on the project.
Charles: I find EViews and Stata easier to use than Excel, which continues to befuddle me. To highlight some of the data difficulties, I’ll observe there are exactly 44 monthly observations on Chinese import prices into the US; BLS did not produce/publish a series before January 2004. The Chinese government started reporting a monthly export price series (unit value index, to be precise), which starts in January 2005. More details of data travails can be seen in this paper.
Oh, I’ve seen missing data problems before, Menzie. More times than I care to think about it. Swampy territory, for sure.