From the IMF’s September Global Financial Stability Report:
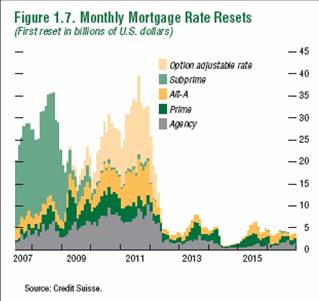
Figure 1.7: from IMF’s September Global Financial Stability Report:
The subprime resets in 2008 should put to rest the notion that the housing market’s troubles are soon to be put behind.
Technorati Tags: subprime mortgages, housing market.
Like whoa!
That doesn’t add up to a lot of money, does it? Just eyeballing it, it looks like at most $300b resets in any one year. Even if you assume 15% default with no recovery, that’s still only $45b out of a $14tr economy, or about 28 hours of gdp, or 32bps of annual production. Hardly a catastrophe. How do you see this translating into something of serious macroeconomic concern?
On what basis would one assume only 15% default? A rate several times that is likely, with very low recovery rates, and this will be self-reinforcing. A default rate of 50% with 30% recovery equates to about $100 billion of hard losses a year.
More importantly, that equates to around 500,000-750,000 foreclosures per year — on the order of 10% of the existing home resale market, and that will be where the real impact will come.
Since around the year 2000 US mortgage debt has doubled to around $10 trillion, while nominal valuations were also doubling to $20 trillion at bubble peak. The impact of the glut of foreclosures piled on top of the glut from overbuilding will drive values about 50% — it would take a nearly 40% drop just to bring prices back into their historical ratio to incomes.
The big deal is going to be the $10 trillion fall in nominal home market values with hardly any fall in mortgage debt. On average, US homeowner equity will drop to zero. Since about 50% of homeowners will continue to have high levels of home equity (because they own outright or have old, low-value mortgages and didn’t use their homes as ATMs). This means that the real pain is going to be concentrated among the other 50%.
Until not too long ago, the US savings rate was about 8%, and had been for a long time. Now it is zero. If it only returns to 8%, the fall in consumer spending will have a huge impact.
If, as seems likely, this also sends the stock market into the tank, another $10 trillion of “wealth” will evaporate.
With these losses of what had been counted on as wealth, there will be even greater pressure on aging baby boomers to save and pay down debt. When everyone is doing their damnedest to pay down debt, central banks find it very difficult to expand the money supply. This is what happened in Japan. Read Richard Koo’s “Balance Sheet Recession”. And don’t think it can’t happen here.
How about if that economy is not $14T…owing to not having the spectacular housing boom to keep it fueled, Mark?
Does $45B look like a reasonable estimate to you (quantizing your brains out, I make it)…or would you say that possibly there could be some “spill-over” effects, like the ones we have already seen?
Stay with us till the end of the month –so that we can review that catastrophe line.
How can a PhD in finance not see this translating into something of a serious macroeconomic concern when we have just had an unusual 50bp adjustment on less evidence?
Yeah, but it is bankers that are going to end up losing money, so they are going to cry about it a lot and demand a bailout from the government and probably get it.
Next year, they will all piously vote Republican and tell the rest of us to “pull ourselves up by our bootstraps, just like they did.”
Since around the year 2000 US mortgage debt has doubled to around $10 trillion
yes, that’s the important number since subprime (ie lax) lending was a prime driver of the price rises since 2000.
Using the “15% default with no recovery” SWAG on $5 TRILLION of post-2000 bubble-debt is a somewhat more threatening stormfront on the horizon.
Note that the only thing keeping the Bush Economy out of recession has been stupendous mortgage equity borrowing levels. Now with that becoming tapped out, we are turning more to credit card financing to keep our standard of living . . . lord knows how long that will work.
This stuff scares me so much I want to be with the Ben Steins and Marc Shivers of the world. . . “nothing to see here citizens, move along” . . .
But what great snivelling potential! Think of the mileage the NYT will get out the foreclosures whatever happens.
Throw in President Hillary as the first female Millard Fillmore and you got real fun!
Marc-
You are new around here. You must understand that when Menzie serves up one of his Dishes of Doom, the Doomsters dig in, adding their own special spices to the meal.
You made the mistake of trying to analyze the situation further, quantifying it, and thereby dispelling fear. Shame on you!
I am fascinated by the bearish/pessimistic mindset. I think pessimism stokes the ego (all you fools do not know that we are doomed – doomed!). The b/p is privy to the knowledge of the select. On the other hand, the b/p may have a political act to grind and the forecast of disaster confirms what he already knows (e.g., “Note that the only thing keeping the Bush Economy out of recession has been stupendous mortgage equity borrowing levels.”)
I am an optimist by nature, but I also recognize that things can go wrong, that policies can be mistaken. I also know that the economy is adaptable, and when the inevitable mistakes are made by some actors, correction comes.
Marc,
The other thing you need to know is that Rich B is not what you’d normally think of as the most self-aware individual. In his world, apparently, everybody who disagrees with is blindly repeating their own views without thinking that they might be wrong, while he in his own far-sighted way “recognize(s) that things can go wrong” despite his optimistic nature. Rich B is the heroic figure, standing above the egotistic pessimists, seeing things for what they are. How do we know that. Because Rich B told us so.
A hero? A hero! I guess I will have to try that on for size. Do I have to buy new clothes?
And I guess I will have to lose weight, too. There’s the rub.
In regards to Marc Shivers point, if one reads the IMF report, one observes in Figure 1.6 that 60 day delinquincies on the 2006 vintage subprime mortgages have already exceeded 15%, 18 months after origination. Since delinquincies tend to peak 24-30 months after origination, then one suspects higher rates (say 25-30%), and hence pretty high rates of defaults (for the correlation between the two, somebody who knows has to chime in here).
But I think there is another, perhaps more important, issue here. It is misleading to focus on the size of a sector alone. For instance, if the size of the nonresidential investment alone were of interest, then I’d tend to agree that housing shouldn’t matter much to GDP behavior. What concerns me is that the first wave of resets had such a large impact on the interbank market. With more resets coming, this means continued uncertainy and heightened downward pressure on the values of these asset backed securities.
To the extent that there is a constant stream of downgrades, it seems that the markets will be constantly buffeted by negative news and hence attempts to jump-start the market via measures like the M-LEC will encounter substantial difficulties.
Slow economic growth going forward (which is the consensus view) should only make the probability of defaults higher. So I think I have some basis for “pessimism”, as it has been characterized.
Menzie-
So you are doubling Marc’s estimate (15% – 25-30%), but he assumed no recovery, which is unrealistic. His number is probably in the same ballpark as yours.
The real problem is “continued uncertainty”, which is based on lack of understanding of the effects on the system. The antidote for uncertainty is investigation and analysis.
Note that those numbers are for first reset. A floater can just as easily default after the second reset, or any subsequent reset for that matter. Even if we assume that 100% of these loans was a 5-year or less, this means the volume of loans resetting balloons until at least the end of 2011.
This is why those 3M and 6M LIBOR rates being all out of wack is so important. If fear and non-existent short-term liquidity drives those up , then households that survived the payment due every month based on that first reset might choke on the payment due based on a rate 100 bp higher after one of the later resets.
Of course, the vast majority of defaults will still be triggered by that first reset, when the shock of moving from lowball teaser rate to distended market rate could mean a doubling of the payment (and here we don’t even include I/O teaser periods).
I second jm’s points and Prof. Chinn’s amplification.
The only way out of this mess, as I see it, is for some terrific increase in American productivity, with the increased proceeds going to paydown debt.
But, as personal consumption appears to be falling, now, I see no real impetus for number one.
jm-
Let me see. According to your figures, valuations on residential housing (I assume that is what you are referring to) were $20T at their peak. You are predicting a fall to $10T, which you claim will wipe out equity. In other words, you are predicting a fall of 50% in value.
Nonsense.
Also, the underlying assumption here seems to be that difficulties in the mortgage market are brand new and not reflected in the bond and equity markets. I don’t think so.
Rich Berger,
More precisely, I am predicting prices will decline back to their historical ratio to incomes, with some overshoot to the downside, which would take them down about 40%. But since it’s likely incomes will also decline, and the overshoot may be rather large, 50% would not be surprising. BTW, Sir John Templeton is also on record as predicting a 50% decline.
In Japan, condominium prices declined 70-80% from the peak.
On what grounds do you opine that a return to the price:income ratio that held for decades is nonsense, especially considering the incredible glut of vacant luxury condos and McMansions that has been built?
The effects will not be “contained”. Condos in particular will be a disaster — there’s an article in one of the Chicago papers today about 20% shortfalls in HOA revenues — already, and as the reset graph above shows, it’s only just begun. The fall in value of condos in buildings with large numbers of foreclosures will be like that in Japan — maybe worse, as there’s no comparable shortage of alternatives here. Who is going to want to buy a condo in a building where the HOA can’t get enough revenues to maintain the building? How big will the discounts have to be to get them to buy? What kind of riff-raff are they going to end up with for neighbors at those discounts?
Above was from jm.
I’ll add here explicitly something that is implicit and should be “immediately obvious to the casual observer” as the physics profs used to say — this crash will put a stake through the heart of the myth that real estate is a sure-fire investment, and the that the best thing you can do is to buy the most expensive home you can possibly leverage yourself into. We are already seeing articles in the main-stream media about how you can rent more cheaply than you can buy. An unprecedentedly large number of single-family homes and condos are on the market already, and the selection is going to grow rapidly in the coming years.
jm-
Thanks. You are on the record with your prediction, and I am, too. Check back later to see who was right.
I don’t think the downturn will kill the idea that real-estate is a sure-fire investment. Real-estate returns from owning your own home appear to be slightly higher than inflation. I bought my current house 21 years ago this month. My net appreciation over that period? Approximately 4.2% per year. Inflation during the period – roughly 3% per year.
On the other hand, one can make huge profits in real estate just like any other speculative venture (say, trading cattle futures). Yes you can do it, but you can also lose your shirt if your timing is not right. I knew prices had peaked in my area (Northern NJ) when I saw speculators come in the market who had no background in real estate. These speculators tore down existing homes and replaced them with larger dwellings – actually selling prices were significantly lower than asking prices – 20-25%. That was in 2005.
Sure-fire. Yes if you are sensible. Returns are pretty modest. But there are plenty of noneconomic reasons to own your own home.
Rich Berger: As an academic, I cannot but wholeheartedly agree with the sentiment that “The antidote for uncertainty is investigation and analysis.”
Unfortunately, those who have access to the data in full (that is both public and private/proprietary) often have mixed incentives regarding analysis. That is, these institutions have an interest in positive (or occasionally negative) tilts to their analysis. Those who can undertake dispassionate analyses often do not have access to the information that the banks themselves see.
That is why it is not clear to me that the relevant financial institutions and market participants have already incorporated into their asset valuations the full extent of the problem. Remember, Fama noted three forms of market efficiency in asset prices. It’s easy to validate the weak-form efficient markets hypothesis in asset prices; strong-form market efficiency is a much tougher thing to demonstrate as being empirically valid.
Thank you jm.
I notice that to get respectable you cite Sir John Whatshisface –in the same manner as Marc exhibits his PhD in Finance (which your modesty does not allow you to indulge) [evidence that indicates you graduated from a different school that has less emphasis on marketing] to make an impression on Rich and not kharris, who, when she is not distracted by pipsqueaks, can demonstrate real intelligence.
Of course, all the “resets” will have less bite if interest rates are lower than they are today. If the housing deflation is as bad as everyone on this board fears, won’t rates plummet? As usual, the answer probably lies somewhere in the middle: the housing slump could be painful, but not quite the FINANCIAL ARMAGEDDON!!! that the bears just know is right around the corner.
Rich B is right. There is something about being a pessimist that makes people feel smart, even though the optimists tend to be right more than they are wrong.
Dean Baker makes the argument that it is not resets but falling prices that are currently driving foreclosures. The defaults for 2007 mortgages are increasing at a faster rate than 2005 mortgages. Most of these mortgages have not even reset yet. The 2007 mortgages were made closer to the peak and therefore the drop in prices has made their investments even more worthless. Hence the incentive to just walk away. It is the loss of equity rather than high payments that is causing these foreclosures. Of course adding the effect of resets in the future will only make things worse, but their effect has not really arrived yet.
But I think there is another, perhaps more important, issue here. It is misleading to focus on the size of a sector alone. For instance, if the size of the nonresidential investment alone were of interest, then I’d tend to agree that housing shouldn’t matter much to GDP behavior. What concerns me is that the first wave of resets had such a large impact on the interbank market. With more resets coming, this means continued uncertainy and heightened downward pressure on the values of these asset backed securities.
which is another way of suggesting, if i read menzie correctly, that the issue is not only that there will be losses of $30bn a year for a few years but that a tremendous amount of leverage is supported through the good offices of financial engineering upon those mortgages — for example, SIVs and conduits full of CDOs and CDO-squareds whose valuations (far larger than $30bn) are dependent on the perception of unfailing future revenue streams flowing from these now-troubled mortgages.
it seems to me that the leverage structure built on mortgages is an order of magnitude larger than the original value of the mortgages themselves, and the unwinding of it as the underlying loans go bad is the (deflationary) sword hanging over us.
The defaults for 2007 mortgages are increasing at a faster rate than 2005 mortgages.
Arnold Kling has an answer to that conundrum. It is called FRAUD.
I think that he is right. How on earth can a 9 month old mortgage be in default? The mortgagee never intended to pay the loan!
Rich Berger writes, I don’t think the downturn will kill the idea that real-estate is a sure-fire investment. … returns from owning your own home appear to be slightly higher than inflation. …[annual net appreciation over 21 years on my current home approx. 4.2% vs 3% inflation].
…
Sure-fire. Yes if you are sensible. Returns are pretty modest. But there are plenty of noneconomic reasons to own your own home.
You sound like a very sensible person who is just not thoroughly familiar with what’s been going on with respect to overbuilding, loose lending, and the underlying demographics and home ownership rates by age cohort.
Coincidentally, just a few months ago I sold my home that I bought back in 1986, at a price equating to 4.57% appreciation over those 21 years, despite having done very little maintenance on it, such that as a home it had less intrinsic value than when I bought it (but the buyer was an investor). But until the bubble started heating up here in the Chicago suburbs circa 2000, appreciation in the neighborhood had been only about 3% a year; the greater-than-inflation appreciation was entirely due to the price rise having averaged 10% over the next five years. Had the price rise continued at 3%, I’d have gotten 24% less. Note that since I didn’t put the home on the market until late August, prices were already well down from the bubble peak.
Without the bubble, my home’s price would only have tracked inflation, despite it having rising location value — absent that, it would have fallen behind. Since the bubble caused an astounding glut of townhomes and condos to be built in the vicinity, absent the bubble mentality the price would have fallen even farther behind inflation. It is that level to which — prbably through which — prices are going to fall going forward.
Amend above “absent the bubble mentality” to “had that glut somehow been built without the bubble mentality”. Obviously, a glut can be built only if there is a bubble mentality, so one can only reason from first principles that a glut built in the absence of bubble mentality would have driven prices down.
“You sound like a very sensible person who is just not thoroughly familiar with what’s been going on with respect to overbuilding, loose lending, and the underlying demographics and home ownership rates by age cohort.”
Well, Professor jm, I just want you to know how much I appreciate you taking pity on a poor fool like me. Almost restores my tattered faith in mankind.
Ha!
BTW, the mentality that’s been driving the bubble certainly wouldn’t view even 4.57% annual pre-inflation a “sure-fire investment”, or reason to have to “buy now or be priced out forever”. The coming decade of falling prices will change the attitudes of American young people to be the same voiced by some young Japanese friends of mine in Tokyo in the late ’90s: “Since Natusko’s getting bigger, we were thinking of buying a condo, but we’ve decided to wait a few years, when they’ll be cheaper.”
Here in the Chicago suburbs, there’s already an incredible selection of nice places for rent at very reasonable rates. Next year will be even better.
Rich Berger,
Sorry to hear that you seem to have taken my reply as a putdown. It was not intended as such.
jm-
Don’t feel bad. I meant every word.
It seems like certain components of “wealth” are like the virtual particle-antiparticle pairs that can transiently wink into existence in the quantum vacuum, but are fated to soon wink back out of existence in the absence of some powerful external force that can pull them apart.
In the dot.com and real estate bubbles, trillions of dollars of “wealth” came transiently into existence as speculators drove up prices on that fraction of the assets being traded, and then all similar assets were viewed as having a true value equal to the price of the last trade.
The real estate bubble has been perhaps more insidious, in that a significant fraction of the illusory wealth was treated as being so real it could be accepted as collateral on loans of real money. Of the nominal $10 trillion increase in US housing “wealth” since the turn of the century, two or three trillion must represent the value of new construction and so have some basis in reality. And another trillion or two can probably be attributed to inflation.
But the rest is illusion, and will disappear back into the financial quantum vacuum from which it came. You can’t create real wealth from nothing.
And since swings in wealth illusion can be negative as well as positive, there’s no good reason to think it improbable that some time after the last interest-only, negative-amortization mortgage has gone into foreclosure the nominal value of US homes will have fallen back to its level 15 years before. That is only just exactly what happened in Japan.
Those of you who think “it can’t happen here,” should consider that the Japanese did not have the enormous level of credit card debt held by Americans. As ARMs start to reset and IO neg-am loans start to be recast, people will be faced with the choice of defaulting on the mortgage or on the credit-card debt. Since doing the latter will result in all their cards immediately morphing to usurious penalty rates, they’ll just send in the keys.
No it wasn’t that
[“You sound like a very sensible person who is just not thoroughly familiar with what’s been going on with respect to overbuilding, loose lending, and the underlying demographics and home ownership rates by age cohort.”],
it was the truly past-ripe move (thoughtlessness) of selecting this arbitrary period over which this
[“annual net appreciation over 21 years on my current home approx. 4.2% vs 3% inflation”]
might be true…even for Rich in his particular local.
It swamped any inclination to consider whether “inflation” was “core” or “trimmed” or just possibly quite diluted with the financial component being so different over those last 21 yrs.
While tryin to confirm jm’s figures for the value of the housing stock (the real figures, not the projections), I found this speech from William Poole regarding real estate. Lots of good historical context, including graphs showing that the value of housing does fluctuate rather significantly and that financial assets are much larger than real estate assets.
http://stlouisfed.org/news/speeches/2007/10_09_07.html
Thank you for posting the link, Rich. Day-job time pressure and the fact that I was working from a computer on which I had no such links bookmarked precluded me from including such references.
A particularly important data source is the Census Bureau home vacancy (and occupancy) stats here, especially the Historical Tables, of which perhaps the most important is Table 12. Household Estimates for the United States, by Age of Householder. Alas, to really see what’s been going on with demographic trends from that, you need to import the data into a spreadsheet and crunch on it a fair bit. Only a few more minutes to type right now, but the significant fact is that the bubble greatly increased home ownership among the young, pulling forward demand which not only won’t be there going forward, but in fact will turn into negative demand when young people who overreached for housing are financially wiped out and disabused of the idea that real estate is a great investment.
jm-
Thanks for the link.
I do not see how the data supports your contention that “the bubble greatly increased home ownership among the young”. If I look, for example, at ownership below age 30, I see fairly stable numbers over the last 10 years (presumably the bubble period). Furthermore, there is a large age cohort, which includes my kids, who do not currently own their dwellings, but will be in the market in the next 5-10 years.
For example, homeownership among 25-29 year olds appears to have increased by 2% per year over the last 10 years. The group just behind them,
continued – the group just behind them less than 25, the “echo boom”, will be increasing and be in the market for housing.
Forgot that the less than sign is an HTML tag – messed up the post.
JM said: “I’ll add here explicitly something that is implicit and should be “immediately obvious to the casual observer” as the physics profs used to say –”
Oh yes, or some calculus or physics books would say someting like, “the intelligent student will realize…” as it goes into some 2 page derivation, leaving out steps along the way.
Rich,
By 2% a year, I assume you mean two percentage points a year — that would be in the ballpark (haven’t got my spreadsheet available). To really see what’s been happening, you need to compute the ratios of the home-owning households to the total numbers of households in each age cohort.
For the under-30 age cohorts, home ownership rates were dropping steadily through the ’80s (from peaks attributable to the late-’70s real estate boom — wild but nothing like the recent bubble) and only turned up about 1993, rising then from record lows to their recent record highs. The current ownership rates reflect the influence of the “gotta buy now or be priced out forever”, “can’t lose money in real estate” mentality, and will again decline going forward. To get the ownership rate among the young up to current record levels required the extreme looseness in lending that underlies the current financial market problems.
The younger age cohort now coming up will not be so eager to buy homes, as they will see their older siblings, cousins, friends of family etc. being financially wiped out, and in many cases being put into many years of financial servitude by the draconian new bankruptcy laws.
(Note that the absolute numbers for households are extrapolations, which is why there are such large periodic readjustments in the data. The CB interview a sample of households and asks questions about whether they own the unit in which they live, whether it’s their true permanent residence, etc — there’s a good summary of the methodology somewhere in the directory hierarchy — and then imputes the absolute numbers of households by some formula. So the ratios are actually measured and much more reliable than the “absolute” numbers.)
On the question of what recovery rates may be …
Trends in bankruptcy law application that may influence future lending …
jm-
Something about that recovery rate article does not make sense. If I lend 100% to a home purchaser, he defaults and I get the home back, how could my recovery rate be 3 cents on the dollar? Even if the assessed value is overstated and the house is worth less than the mortgage, I could understand 70 cents on the dollar, but not 3 cents. Unless these are second mortgages, of course. But then you are talking about a subset of mortgages.
I think they are second mortgages – probably home equity. Note the following:”Legal costs relative to the low loan balances are huge and delays are long. Values of the homes are nowhere near what they were, so they?re looking at negative equity.” Low loan balances?
I don’t think your cite is applicable to the market as a whole.
I read this far, but really you all need to know more about mortgages. The first mortgage holder will get the house after past due real estate taxes are paid. Second or subsequent mortage holders will get 0, in most cases. Buyers will be found for most homes although at prices below what the first owner paid.
Demographers who are almost always wrong still feel that family formation and growth will keep a steady demand for new houses above the current level of home construction. The excess inventory is being consumed at some rate.
Be glad you are not homebuilders or land developers. Their leverage exceeds what you would believe.
Rich,
I linked to the article after seeing it linked elsewhere, in a comment that excerpted only the main quote that ended, “… The servicer asserted the rating agencies are incorrect … recovery rates of 60% are unattainable. … 30% is also currently unattainable. Being short of time, I didn’t continue on down to “Tavakoli says the servicer has been selling loans for 3-6 cents on the dollar.”
That’s truly startling, even to me.
But Tavakoli is someone to be taken seriously. She has published two books through Wiley (one of which I believe I have, and found solid and serious). Her website.
I note that the article had earlier mentioned lender staff putting in 13-hour days, and continues, “… What are the issues? Legal costs relative to the low loan balances are huge and delays are long. …” I note also that it didn’t say it was selling all loans at 3 to 6 cents on the dollar; I suspect there ought to be a “some” in there. From what I’ve read about the situation in some areas of Ohio and Michigan, and in inner-city areas where the lending was truly predatory, it wouldn’t take a lot of legal fees and delay-related costs to erode value far below 30% — the loan values may have been only about $100k to start.
The mentioning of 60% recovery as unattainable implies the loans are not seconds or HELOCs. No one would even think of 60% as being a possible recovery on a subprime second right now. This must be a subset of subprime first mortgages.
John writes, “Demographers who are almost always wrong still feel that family formation and growth will keep a steady demand for new houses above the current level of home construction.”
Is it the demographers who are always wrong, or the industry cheerleaders who try to use the stats to prop up the myth that prices will never fall?
Consider that the US population hasn’t been growing very rapidly, only around 1% per year, so the rate of household formation (which we can only roughly estimate — see my comment about Census stats above) is only around one million per year. Following my own link down, I see that the Q2 2007 vs Q2 2006 comparison for estimates of occupied housing units (i.e., households) is 110,341k vs 109,450 — under a million new households, and that they estimated only a 56k — yes, 56,000 — increase in those considering themselves homeowners! All the rest of the increase went into the renter category! As I noted above, what they directly measure in their surveys is the fractions of their samples that call themselves homeowners vs. those who call themselves renters, so the ratios are more reliable than the absolute numbers.
From 1994 through 2004, the fraction of household heads telling the Census they were homeowners rose steadily by half a percentage point every year (though the fraction had formerly fluctuated between 63% and 65% for a long time). This is direct evidence that the production of for-sale housing (and/or conversion of rental units to same) was running that far ahead of net new household formation in that period. And since for most of that period there weren’t many rental-to-sale condo conversions, and production of for-sale housing units was far below recent levels — and a lot of “second homes” were being built, it’s clear that production below those late 1990’s rates will be quite adequate to meet demand due to new household formation. (Especially since in hard times the household formation rate drops, as young people continue to live with their parents, instead of buying a condo.)
October 22, 2007
Sometimes I wish that this blog would get more comments. At other times, I’m glad that I don’t have to make the decision ten times per day on whether a particular comment is so ad hominem that I have to zap it. Today is one of those other d…
Actually the rate of household formation is commonly and widely estimated as being around 1.35-1.4 m. It depends not only the change in population but also the age of the population.
The older you are the more likely to be living on your own (up to about 80) and so household formation increases with the age of the population. Typically models forecast headship ratios by 5 year age brackets.
You also need to allow for “teardown” or replacement demand and empty (holiday) house demand.
In my view there is a reasonable standard deviation on each of those parameters. And also the parameters depend on the larger economy, but paticularly housing affordability.
jm-
In the end, you have tossed up a lot of information which appears to support your case, but which on closer examination does not. I gather from your second to last post that you still do not understand that the loans referred to in the 3-6 cent recovery rates are relatively small, second mortgages.
Rich, I see no indication in the linked article that the loans being sold for 3-6% are seconds. Note that the fact that they can be sold for 3-6% implies that the ultimate recovery rates on them to the purchaser are sufficiently above that to yield a profit after all the legal and other costs are paid — the recovery is 3-6% only for the original lender. I believe that the recovery rates for subprime seconds in this environment are zero.
David Leitch,
As I noted in several places above, the Census estimates for absolute numbers of households aren’t very reliable. In their “Table 12” to which I linked above, you will find in 2002 a negative adjustment of 3.5 million to the household count, which if prorated linearly over the nine years since the previous adjustment (1993) knocks 0.4 million off each annual increase and brings the average net increase for those nine years down to about 0.8 million. The much higher number you believe to be “commonly and widely estimated” must be for gross household formation (and might perhaps based on the over-estimates adjusted away in 2002).
The 2007-Q2 release to which I linked above estimates a 0.89 million net increase in number of households, with nearly 94% of that increase in the renter category. Since that ratio must very closely reflect what Census actually measures (perhaps they weight ratios measured in different areas differently), that ratio is what I think is most important, in particular the trends in it, as there we are presumably seeing the results of a series of polls of the same sample areas.
Note that when one contemplates trends in the owner:renter household ratio and its relationship to the number of housing units constructed, teardowns, replacements, and vacation home building are of much less interest than if you try to use the flaky absolute household count estimates. We know that the consistent 0.5 percentage point per year increase in the ownership ratio between 1994 and 2004 equated to about 0.4-0.5 million for-sale housing units being either constructed for sale or converted from rental housing, net of teardowns, etc. Since it was only near the end of that period that one heard much about conversion of rental apartments to condos, I think it’s a fairly safe bet that construction of for-sale housing was running about that far ahead of the steady-state (ownership ratio) production rate (which would include teardowns/replacements and vacation home construction, as they have no effect on ownership ratio).
That is completely consistent with what I have seen here in the suburbs of Chicago — hardly any rental complex construction, but pell-mell building of condos and townhomes (with rental complex conversion to condos beginning only just before the bubble began to stall out).
If the ownership ratio reverts to the mean — a not at all unlikely occurrence, as there were presumably some good reasons for it hovering between 63% and 65% for decades, and getting it to its current levels required unprecedented looseness in lending, now a thing of the past — then millions of housing units constructed with owner occupancy in mind are going to be converted to rentals. Since they weren’t designed as rentals, and are intermixed with owner-occupied housing bought by people who didn’t intend to live in such a mixed-mode community, this will be interesting.
The meltdown will be caused by the 35B plus 40B plus in subprime losses, alt A loses and adjustable loses combined…pushing a massive crash colliding into the debt market where all the SIV’s tranches live. You can watch the dollar decline along with a massive inflation, hyper inflation and the government and their hords of thieves keep spending what little the American People have left…so it is. To hard assets my friends, that’s all we little ones can count on …if that….
About the suburbs of Chicago …
The number of luxury condos and million-dollar-plus McMansions sitting vacant on the market here is astounding. In Arlington Heights, the number of million-plus asking price homes on the MLS in mid-summer peaked at about 36; it’s now down to 21, not because 15 sold (only four sales through August above $1 million), but because asking prices have been cut. But the price cuts are nowhere near deep enough to get those homes sold.
If one estimated the demand curve based on the actual sales of the previous year, one might expect price cuts of about 30% would clear the inventory. But would they? Few buyers of million-plus homes are so wealthy that they can buy a new home without selling their current one, and as the million-plus homes fall 30%, so will those in the price ranges below. According to the research of Chris Cagan, nearly 40% of US homeowners have less than 30% equity in their homes. From his stats, when taking real estate commissions and closing costs into account, one can deduce that rather less than 50% of homeowners would be able to get any significant equity out of their homes in a sale at 30% below bubble peak prices. A 30% fall in home prices, therefore, will drastically reduce the number of people who would rate as “qualified buyers” from a sales viewpoint — and since that will invalidate the demand curve estimated from earlier years’ sales, the market-clearing price drop must be even greater. But the greater the price drop, the fewer the people who can get out of their current home without bringing a check to the closing, and the larger those checks must be.
The real problem is not the subprime mortgages per se, it is the astounding glut of supply called forth by the illusory demand-curve shift that was created by the ludicrously loose lending of which those mortgages were a symptom.
jm-
Expanding my prior quote from the article you cited – “Tavakoli says the servicer has been selling loans for 3-6 cents on the dollar. What are the issues? Legal costs relative to the low loan balances are huge and delays are long. Values of the homes are nowhere near what they were, so theyre looking at negative equity.”
Legal costs are high relative to low loan balances – how do you explain that if they are not second mortgages?
Rich,
The loan balance on many subprime first mortgages, especially the really predatory ones to minorities and old people in poor areas, are not very large, and there has been fraud in the appraisals, so the price for which the collateral can be sold is low. “huge relative to the low loan balances” doesn’t to me imply “larger than the loan balances”.
But the real problem for the housing market is not the “subprime crisis”. It’s the astounding glut of unsold and vacant inventory in the mid-range and high end of the market, in a situation in which lending standards are reverting to historical practice, and in which large amounts of demand have been pulled forward by elevation of ownership rates to record levels among the under-35 age cohorts.
Jm-
I don’t think you are responding to my questions, but you are under no obligation to do so. I don’t see any point of pursuing this further, but it has been stimulating.
‘Stimulating?’ You mean like watching paint dry?
When can we get onto the how many angels on the head of a needle count, please?
After staring at this for a while I came to the hideous realization that 2010-2011 is actually much worse than 2007 and 2008. The peaks are for subprime in ’07-’08 look like the peaks in Option ARM in ’10 and ’11 – but the Alt-A, Prime and and ‘agency’ curve all get higher in the out years – and they are obscuring each other, you have to add them together to get the total at any point in time.
And anybody that doesn’t think that Option ARM and Alt-A won’t explode just like sub-prime is – or that prime ARMs are really better than subprime ARMs (not – a higher FICO score doesn’t make you any less screwed when the rates reset) – I got a bridge for you. Not to mention a house.
Bob
And the reasoning behind and evidence for your conclusion is?
Rich,
As far as the number of resets, just looking at the graph and realizing that all the categories are additive at any point in time. Just adding the Option ARM and Alt-A (aka “liar loans”) together is enormous.
As far as the likely futures of Alt-A and Option ARM, I think the early experience on that speaks for itself. And I don’t really expect that just because someone has a higher FICO score that they will be any better at dealing with a reset or a recast – everybody got these toxic loans on the premise that “you can always refinance” – and that ain’t happening with everybody underwater.
Bob, this is not what I am seeing.
We are still seeing loans being offered to those with good credit. Good risks can get money, if and when they need it. Backed up with property, just makes it better/easier.
CoRev,
Sure, “Good risks can get money, if and when they need it.” – but at best that covers the prime curve on the graph. (And if they are so prime, why did they go with ARMs in 2005 and 2006 when rates were already clearly increasing?)
It still leaves the Alt-A and Option ARM folks – and the sum of those curves alone is amazing. The majority of Option ARM folks are making minimum payments, (though I’d have to dig a while to find the source of that stat, but it makes sense because their inability to otherwise qualify is why they have Option ARMs in the first place – unless they are speculators who will cut and run earlier), which means that they will not only have their rates reset, but also be “recast” into fully amortizing loans. The payment shock of those 2 events will be immense to those borrowers.
I’m assuming that most of the Alt-A lied *a lot* about their income to get in. Why the heck else would somebody take the extra interest and points that came with no-doc/low-doc? Some of them are speculators who will probably default much sooner. To that extent the curve gets pushed closer to the present.
Some excerpts from a WSJ article regarding Option ARMs are posted here over at Calculated Risk. One quote, “More than 80% of borrowers who are current on [option ARMs] make only the minimum payment, according to UBS.”
A related WSJ article, Countrywide’s New Scare, notes that Mr. Mozilo told investors in September 2006 that he was “shocked” so many people were making the minimum payment. He called a sampling of borrowers to find out why. The “general answer…was that the value of my home is going up at a faster rate than the negative amortization,” he said. “I realized I was talking to a group…that had never seen in their adult life real-estate values go down.”
Over at Calculated Risk, a must-read post on the subprime situation.
From the same WSJ article, about CountryWide, quoted at Naked Capitalism:
low-doc, high LTV *and* Option ARM – does it get any better than that??
How can ’10 and ’11 be anything but complete disasters?
Actually, staring at the chart some more, I think the graph already did the addition of which I spoke. My bad. Nonetheless, ’10 and ’11 will be very rocky, as I think that most or all Alt-A, Option ARM, and signinficant amounts of prime ARMs will all be in trouble.
Well you guys can quote the grim reapers at CR all you would like. Maybe I will, too:
“An analysis prepared for The Wall Street Journal by UBS AG shows that 3.55% of option ARMs originated by Countrywide in 2006 and packaged into securities sold to investors are at least 60 days past due. That compares with an average option-ARM delinquency rate of 2.56% for the industry as a whole and is the highest of six companies analyzed by UBS.”
Wow. 3.55%. Sounds like a disaster.
But Rich, it’s only just the beginning of the beginning, and already more-than-60-days-past-due for the 2006 vintage is at 3.55%. I think that for loans only about 15 months old, on average, that’s horrendous performance. And the big rate resets and recasts are still to come.
More good commentary on the option ARM situation at http://www.housingwire.com.
Resets
Monthly mortgage rate resets, 2007-2017(source: Credit Suisse via IMF)
Hat tip: Menzie Chinn