We’ve been dwelling here quite a bit on the bleak incoming housing data. But I have to admit that I’m not seeing that spilling over so far into some of the other key economic indicators.
Auto sales usually fall a bit between August and September, and perhaps declined slightly more than normal this fall, with total light vehicles sold in the U.S. in September down 3% from September 2006.
 |
Domestic cars, like domestic light truck sales, were also down about 3%, and given the gloomy long run trend there, that makes this the worst September in 5 years for domestic autos, though not by much.
 |
Not great, but taking August and September together, I think we can safely say that the bottom did not fall out of the market in some kind of psychological reaction to events in mortgage and financial markets over the last two months.
 |
The Conference Board’s consumer confidence index fell 5.5% in September, which again raises a concern but is not enough by itself to be really alarming. Moreover, the University of Michigan’s closely related index of consumer sentiment was unchanged in September. Both indexes had shown about a 6% drop in August, which essentially wiped out a similar-sized gain in July. Again, I read this as a modest deterioration, but not the dramatic response to the August financial turmoil that some of us had feared.
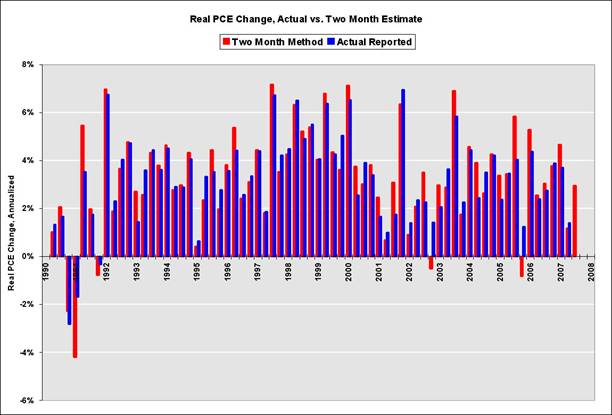
Calculated Risk notes that you can get a pretty decent estimate of where the quarter’s personal consumption expenditures will end up using the two months of data that we now have for July and August. That calculation suggests we’re on track for 3% growth of real consumption expenditures for 2007:Q3. It would take some pretty bad numbers for September to turn this into a mediocre quarter on the consumption side.
 |
On the employment front, weekly initial new claims for unemployment insurance have been trending down this month, and online advertised job vacancies were up 4% in September. Automatic Data Processing is estimating that nonfarm private employment increased by 58,000 net workers in September. All of which makes it pretty likely that the BLS payroll numbers reported on Friday will look substantially better than last month.
 |
And, as Menzie noted yesterday, the stock market does not seem to believe we’re about to plunge into a recession.
Here’s how Tim Duy puts it all together:
the Fed is overestimating the downside risk to the economy. Certainly, the past correlation between housing downturns and recessions is nothing to ignore. But too many indicators are not consistent with a recession for me to be embrace a dark outlook. Why are initial unemployment claims flat? Why does the consumer appear to have momentum in the 3Q07? Why are readings on manufacturing activity not solidly on the decline? Why did the inventory to sales ratio slide back to its lows? Why does the Baltic Dry Index continue to reach new highs? Why isn’t faltering demand undercutting support for oil prices?
We’ve been staggering along for over a year now with a very poor housing market subtracting 1% from GDP growth while the rest of the economy overall continued to grow. Who’s to say things won’t just continue that way until the overhang of unsold houses eventually wears off?
It’s not an unreasonable expectation. But selling off that overhang likely also involves significant declines in real estate prices. And it’s hard to ignore the potential implications of those price declines for mortgage default rates, financial failures, and the psychology that’s so far still holding consumer spending up.
Not enough to persuade Tim to embrace the Dark Side, no doubt. But I’m sure that, like the rest of us, he’s eyeing her over.
Technorati Tags: macroeconomics,
autos,
auto+sales,
consumer confidence,
economics,
recession,
subprime
PLEASE learn yry and pulling demand foward. That explains your auto sales and why September was weak and WHY future months will be even weaker.
You also need to understand, “1%” losses in residential growth aren’t that big. At some point, residential growth will start falling at 2% during the busts peek downturn.
Consumer spending has weakened over the course of the year. Your not seeing it because it is just happening. Why do you think job creation has gone downhill? Weakened consumption and the real beginning to RE layoffs.
It goes hand in hand.
Hence, the economy really isn’t growing that much. Your in error and it shows. The revisions downward in 2006 GDP, show this. Now we need the next phase to begin=lights out.
Good, balanced read, Professor.
Quantitatively, to-date, you are right; the data is not depressing.
The problem is the big, ugly ‘soft’ factors out there, looming in the near future: the huge inventory overhang in housing and the big ARM resets upcoming, for both subprime and Alt-A/prime; the increase in risk premium and the decrease in risk appetite (look at the sharp drop in Q3 M&A activity and the recent contraction in commercial paper).
When this settles into the public’s consciousness, it is going to be ugly, I think.
Cherry,
I’ve been reading that the downturn will start next quarter for eight straight quarters now. You will eventually be right, but don’t expect much credit for a 0.125 batting average.
Cherry, year-to-year change is exactly what you see in the first two graphs when you look across the 5 bars for any given month. The 3% numbers mentioned in the text are all year-to-year comparisons.
Housing prices topped out in August 2005. This housing slowdown has been so slow moving that it has allowed the other sectors of the US economy to compensate.
Checkout the booming agriculture, healthcare, education and export sectors.
You also need to understand, “1%” losses in residential growth aren’t that big. At some point, residential growth will start falling at 2% during the busts peek downturn.
There is roughly a 0% chance that housing will subtract 2% from GDP. The busts peek downturn you speak of was last summer/fall, back when starts were declining at the most rapid pace and when residential investment was the highest % of GDP at over 6%. After Q3, RI will probably be 4.5% of GDP, which means housing starts would have to start declining at a significantly faster rate than last fall to exert a 2% drag on GDP.
I never hear people talking about the “free” money available to people facing foreclosure. Once you know that you’re going to loose the house, what you used to put into your mortgage payment is now available for other things – presumably none of those people would be sending it to the bank. That seems like a pretty substantial injection of cash that might make things look significantly better than they really are. Is this just too small a factor to measure?
Prof. Hamilton,
Is it valid to talk about GDP, Unemployment, and other macro indicators without mentioning debts and deficits? Is this the dirty secret we don’t want to discuss? What are the contributions of debts to the economy? And the amount of leverage debts on other debts is by some account in the hundreds of trillions! Creative financings with derivatives definitely provide the fuels for buy-out activities and speculative stock price run-ups recently. Is our economy really sound fundamentally or built on debts and deficits? I am perplexed and hope that you would, if time permitted, address some of the issues regarding this matter.
nouriel’s blog at rgemonitor touched on the BLS employment situation due on Friday recently. Could someone help me to understand the birth/death model and how it relates to the annual benchmark to estimates? Also, I have been unsuccessful in finding stats on past benchmark revisions to the estimates at bls.gov.
Scott, I discussed the BLS birth/death model here.
The big question in my mind is, how can consumer spending continue to grow if housing prices level off or decline? I had the impression that the housing boom was funding an increased consumer debt load which alowed them to continue to decrease savings and increase spending. Once housing stops increasing this funding mechanism is no longer available and we should see consumer spending growth disappear.
Hal,
I know I am old fashioned but there is this thing called personal income.
Not all the news is that bad (except for housing), but fundamental change is afoot:
http://research.stlouisfed.org/fred2/series/DBAA/chart?cid=47&fgid=&fgcid=&ct=&pt=&cs=Medium&crb=on&cf=lin&range=Custom&cosd=2007-01-02&coed=2007-10-01&asids=DGS10+&cg2=Refresh+Graph
We’ll see higher interest rate expense hitting corporate profits beginning this quarter.
“I’ve been reading that the downturn will start next quarter for eight straight quarters now. You will eventually be right, but don’t expect much credit for a 0.125 batting average.”
A great point… and a great analogy…
With one further baseball twist..
Knowing your accuracy.. or as the decision theorists like to say your “calibration” is only part of the battle..
If you bat 125 for too long you’re not even in the line up when the opportunity comes…
Look at poor Bill Gross and the poor economists at Goldman… both forced out of their positions (batting line up) long before the easy pitch.. came to them..
We are at the end of a 5 year expansion that was primarily fueled by housing debt and huge government spending!
We already have a 10 month supply of housing …and the worst of the ARM resets is in the 6 months ahead of us!
I think there is still some MEW floating around out there and not enough damage has been done yet by housing yet, but that it will start to get really ugly by Christmas. Eventually thought, there will be a couple million homes out there NOT generating revenue and depreciating in value.
If anyone disagrees please answer this: People said that the imploding Tech Bubble would not pull us into a recession, but it did. Why are the Bulls right this time when the bubble is much bigger?
Q: What is the difference between Pets.com and a sub-prime, no doc, no down, 120% LTV, 2/28 teaser ARM??
A: The decade.
October 3, 2007
The latest passion on the Street is telling everybody how lousy everything is! PIMCO & TIAA-CREF hate the market, Greenspan hates the market, Credit Suisse hates the market … there’s no shortage. But it takes two to make a market! Ja…
“If anyone disagrees please answer this: People said that the imploding Tech Bubble would not pull us into a recession, but it did. Why are the Bulls right this time when the bubble is much bigger? ”
Liquidity, and the underlying value of the assets.
“Q: What is the difference between Pets.com and a sub-prime, no doc, no down, 120% LTV, 2/28 teaser ARM??
A: The decade.”
A2: When 120% LTV defaults in 10% overvalued market, loss is capped at 32%. Pets.com lost 99%
A3: Cutting off MEW increases marginal demand for income.
>> A2: When 120% LTV defaults in 10% overvalued market, loss is capped at 32%. Pets.com lost 99%.
According to Case-Shiller we are in a 100% overvalued market, but the futures predict a 20-30% drop over the next several years.
Also, what happens when all those ARMs reset and the value of the home is less than the debt (so no one can refi)? Banks are gonna have alot of depreciating capital that generates no income.
Finally, your point about Pets.com losing 99% of it’s value is correct, but it really comes down to the mix. Obviously many tech companies survived and thrived, just as many homes will continue to be lived in. I don’t think anyone can predict predict the exact impact yet, but ignore it at your peril.
Nice bunt phyronic.
‘Name’ writes
A3: Cutting off MEW increases marginal demand for income.
and does this mean more tax cuts…or are you making that larger point about the incapacity of workers to empower their wage demands?
The auto picture is indicative of the broader picture for me, starting with peak sales ~2005 despite a growing population and projections from the majors that the decline will continue. It’s not as if buses suddenly became more attractive. No, GDP may have continued to climb at 3%, but its close relative, the standard of living, may have declined…or, the real hardware of the economy may be misrepresented by the official measures that are compromised by truly heady housing numbers that are not contained in that little box RI, but pervade the entire economy.
All of which makes it pretty likely that the BLS payroll numbers reported on Friday will look substantially better than last month.
And they did. Just about expect, 110,000. Strong but expected revision of the August numbers from -4,000 to +89,000, mostly because of timing in the hiring of teachers and other school employees.
I see today’s (10/5) revised employment figures show a net gain in jobs (+~20K) compared to the initial 4,000 job loss.
Another disappointment for those desparately seeking disappointment.
Seriously disappointing disappointment…for those who manage the trick/stupification of accepting 110,000 today while accepting the correction (-4000->89,000) last month…which are still not “final”.
Which still does not address the issue of what is happening to all those workers associated with the housing market which seems to be in decline. It does…not a temporary correction, but a decline (Can you handle “bust”, “major adjustment”, “collapse”?)
That housing market as the driver of the economy…twas so overblown on the way up (we now say on the way down). The rest of the economy was as equally driving…is the desperate “blowin” (no careful examination of the records) on the way down, no?
We shall see, people…you won’t be disappointed.