Last week, I wrote a post examining what the measures of central tendency for the dollar’s trajectory were, based upon some standard forecasts. This week, I want to examine more closely whether we should anticipate more depreciation, in real terms, by way of discussing alternative measures of the dollar’s value.
As I’ve discussed in elsewhere [pdf], most real measures of currency values weight by some measure of economic interlinkages. While some more recent ones are linked to assets or liabilities, the most common by far is the trade-weighted measures. The standard ones, including the IMF’s, the BIS’s, and the Fed’s, are based upon changes in bilateral real rates. That is, the index is based upon a base period, then changes in bilateral real rates are weighted by trade flows, and added to that base value. This calculation is discussed in this post.
While this calculation makes a lot of sense, it has several interesting attributes, one of which is best highlighted by an example. Suppose the US trades with a country — call it X. Suppose the bilateral real exchange rate against X stays constant, but the amount of trade between the US and country X increases dramatically. Invoke ceteris paribus, and in the standard calculation, what will happen is that the overall measured index of currency value will be unchanged.
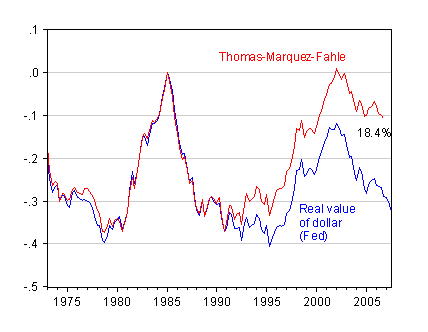
What happens if instead one calculates using levels of exchange rates in real, common terms? As recounted in a previous post, the trend value of the US dollar looks a lot different. The series I’m going to rely upon is the (revised) Thomas-Marquez-Fahle [pdf] index [Note: This measure of U.S. international relative prices is not officially produced by the Federal Reserve Board. In other words, it is not the FRB-measure of U.S. international relative prices.]

Figure 1: Log real value of the USD (broad) and Thomas-Marquez-Fahle index, rebased to 1985q1=0. Source: Federal Reserve Board, personal communication, and author’s calculations.
I’ve rebased both the standard Fed real broad index of the dollar’s value and the Thomas-Marquez-Fahle index to 1985q1=0 (in log terms). What becomes obvious is that the dollar peak in 2002 was as high as that in the mid-1980s. What’s the implication then (this is my interpretation)? That the dollar was — and remains — relatively strong. Rebasing the series to 19851, one finds the two series have diverged by 18.4% (in log terms). Of course, this calculation is not insensitive to when one rebases the series — if one rebased them to equal 0 in 2002q1, the gap would be only 5.4%. The point is that, taking into account levels of exchange rates, the dollar is stronger than what one might perceive on the basis of conventional divisia indices.
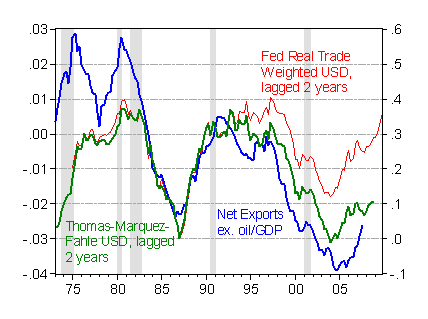
Readers of this blog will know that I have spent a lot of time trying to model in a partial equilibrium (some would say old-fashioned) approach the determinants of the US trade balance (see here). I can usually obtain sensible estimates of price and income elasticities using multivariate cointegration techniques, but usually have to incorporate some deterministic trends (see these papers: [1], [2], [3] [pdf]). From a statistical standpoint, these trends make sense. From an economic perspective, I am always queasy about having these trends explain a lot of the time series behavior of the variables of interest. The Thomas-Marquez-Fahle index eliminates some of that reliance on “trends”, even in the “ocular-regression” context. To see this point, consider the figure below. I plot the net export (ex. oil) to GDP ratio in blue. I’ve also inverted the log real exchange indices so that we now have exchange rates instead of currency values plotted, and lagged them 8 quarters to account for lagged adjustment.

Figure 2: Net exports ex-oil to GDP ratio (blue, left axis), log real value of USD exchange rate (red, right axis) and Thomas-Marquez-Fahle index real USD exchange rate (green, right axis), rebased to 1985q1=0. NBER-defined recessions shaded gray. Source: BEA GDP release of November 29, 2007, Federal Reserve Board, personal communication, NBER, and author’s calculations.
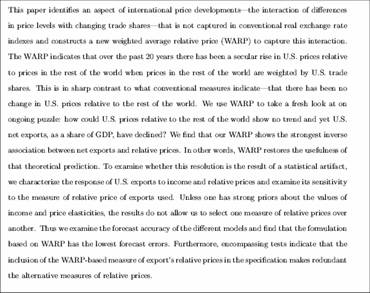
What’s apparent is that the Thomas-Marquez-Fahle series tracks the trade balance much better. The authors confirm this point for exports:

This suggests to me (this is not asserted in the Thomas-Marquez-Fahle paper) that there is still substantial dollar adjustment required in order to get the net exports ex-oil to GDP ratio to something around 1% of GDP. This conclusion, by the way, is not inconsistent with the view forwarded by Brad Setser that the dollar has declined by a sufficient amount to induce some adjustment. It’s also a view consistent with why we haven’t seen more global rebalancing. It’s definitely not consistent with this view, and measures of central tendency cited in this post. This suggests to me that in order to reconcile the two perceptions, some low-probability event (at least as perceived by the markets) has to happen. Some examples are here.
[minor corrections/deletions in notes to Figure 2, 5pm Pacific, 12/12]
Technorati Tags: href=”http://www.technorati.com/tags/dollar”>dollar,
exchange rate,
href=”http://www.technorati.com/tags/purchasing+power+parity”>purchasing power parity,
depreciation.
just to clarify my view — i differentiate between the $/ euro and the “dollar”, and specifically the $/ asia and the $/ emerging world. I do think the dollar has fallen enough v the euro to induce adjustment in the us/ european bilateral trade balance, and to give us producers an edge over european producers in third party markets.
on the other hand, china has depreciated nearly as much v the euro as the US — and the moves in the $ v non-european currencies (especially v asia and the emerging world) have to date been too small to induce the desired adjustment.
that explains why i think the $ may be a bit too weak v the euro (but only a bit) while being too strong v. much of the rest of the world. the thomas-marquez-fahle paper is important here, as it suggests (as noted) that the $ was much stronger than commonly thought back in 2000 — and is still stronger today v a broad set of currencies than is commonly thought.
hence i agree with your conclusion that more $ adjustment is needed; the question is against whom does the $ adjust!
Any way to enlarge the Thomas-Marquez-Fahle segment which is illegibly small?
I think this kind of analysis is seriously handicapped by the absence of even rudimentary measures of uncertainty. Menzie’s work on the renmimbi is a great example of the importance such measures have for just this kind of issue.
Ask instead “What are the odds that the dollar has bottomed?”
Wonderful put Dr. Chinn. Your best post yet ?
I tend to agree with your current view that more $ adjustment is needed to make a meaningful impact on the Deficits amongst other problems.
TO answer BRAD , “the question is against whom does the $ adjust!”
The simple answer is… AGAINST ALL THOSE PEGGERS.
Chinese Yuan
Indian Rupee
Saudi Riyal
form a good list
I would Japanese Yen to that.
brad setser: Good point; I agree completely that the dollar adjustment that will occur is unlikely to be proportional to what has happened in the past.
Calmo: I will try. There’s a nonlinear trade-off between size and legibility for reasons that are not clera to me.
Simon van Norden: I agree that it would be useful, but that’s hard. If you have suggestions, I would appreciate it. I think there are variety of ways to go. A mostly statistical approach would be to characterize the dollar index (of any sort) using a Markov switching type of approach (a la Engel-Hamilton). Another approach would be to use a threshold autoregression regression. I’m going to leave that to people who are smarter than me (and who have more time!)
Dr. Dan: In a multitude of posts, Brad Setser has indeed identified those currencies and more (well, maybe not the rupee). See also this post and this news article.
The trade balance itself is twisted so that your projected exchange rate adjustment would be biased for the real economy. Consider, China would export any good to US if US is willing to import. But in the other way around, it either that US is willing to export its such as financial service but China does not want to import, or that China wants to buy high tech stuff that US rejects to sell. Since the trade balance does not reflect the comparative advantage and real economy, the exchange rate adjustment based on trade balance looks dubious.
Its refreshing to see that the FED is supporting research in developing more realistic modeling of currency value.
Relative to whether the dollar is nearing the bottom, some common sense is helpful. The Geometric Aggregate price level for Emerging Economies currently is approximately 2.2 versus the dollar (Fig.5 in the WARP paper). Emerging economies have also increased their trade weighting to the US from about 25% in 1976 to about 48% in 2006 (fig.2 in the WARP paper). Its inevitable that real US price levels have a very long way to adjust in order to be competitive. Realistically, that can only happen through inflation (currency devaluation of the dollar). Because of the magnitude of the current account deficit, this adjustment will be rapid in the US. Longer term, the same adjustment will occur in other developed industrial economies as their competitiveness erodes.
Menzie,
With the additional comments by brad setser in particular, this looks about right. Very well done post.
However, this seems to suggest that the exchange rate is indeed being driven by the PPP fundamental. Does this undo your result showing ongoing strength of the random walk result? Your invocation of the old Engel-Hamilton approach in this regard is most telling.
(well, maybe not the rupee).
May I know why you think Rupee is not a candidate ?
Indian economy is growing at 9% Per annum.
The rupee has already appreciated 12% over USD
Stock market is at all time highs ?
Inflows are too high that govt wants to moderate them.
Things are so good that I put that INR in the top of the list ??
Interested to know ur thoughts.
Dr. Dan: I have no opinion on the Rupee. What I meant is that I wasn’t sure that Brad Setser had opined on the rupee. He might have, but I can’t recall.
Menzie,
I wondered if you have seen Ian Fletcher’s explanation for the behaviour of the dollar?
Ian Fletcher, The global economy bubble equilibrium, post-autistic economics review, issue no. 44, 9 December
2007, pp. 23-30, http://www.paecon.net/PAEReview/issue44/Fletcher44.pdf