Currently available data on consumer spending make it very unlikely that we’ll see negative real GDP growth for the fourth quarter.
The BEA reported on Friday that seasonally adjusted real consumption spending grew at a 6.5% annual rate between October and November. As Calculated Risk has noted in the past, this takes much of the guesswork out of predicting what the fourth-quarter numbers will turn out to be. The quarterly consumption component of real GDP is just the average of these monthly numbers, so we now have two of the three months that will go into 2007:Q4 consumption spending.
Following CR, blue bars in the graph below represent the growth rate of the average real consumption during the first two months of a quarter relative to the average real consumption over the first two months of the previous quarter; (my numbers differ slightly from CR’s in that I’ve measured growth rates from changes in the natural logarithm, which correspond to continuous compounding and make the algebra a little simpler). Green bars in the graph report the actual growth rate for the quarterly consumption component of real GDP. The October and November 2007 data imply an estimate of the growth rate of real consumption spending of 3.2% during the fourth quarter of 2007.
The two-month estimate has an R2 of 80% in predicting the actual quarterly numbers, and a root mean squared error of 80 basis points. The latter can be used to construct a 95% confidence interval for the 2007:Q4 forecast. The 3.2% estimate for 2007:Q4 implies a confidence interval between 1.6% and 4.8%. That Normal confidence interval can also be bootstrapped, by the way– only 4 out of the 69 errors since 1990:Q3 exceed 160 basis points in absolute value.
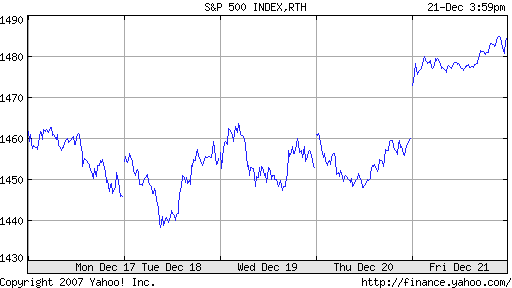
With 2007:Q4 real consumption growth in the ballpark of 3%, it’s extremely unlikely that we’ll see the negative real GDP growth for 2007:Q4 that some analysts had been predicting before the strong November retail sales figures came in. The stock market seems to agree:
 |
Technorati Tags: GDP,
personal consumption expenditures,
macroeconomics,
economics
Might want to check this out:
“The CFO Nose”
http://www.financialsense.com/Market/wrapup.htm
Analysis of CFO sentiment versus the highly massaged BEA numbers. Something stinks, that’s for sure.
Jim, I hope you’re not mixing apples and oranges!
“Currently available data on consumer spending make it very unlikely that we’ll see negative real GDP growth for the fourth quarter….The 3.2% estimate for 2007:Q4 implies a confidence interval between 1.6% and 4.8%. ”
I’m guessing your regression is based on the latest available vintage that you downloaded recently. This contains both heavily revised data (oranges) and the most recent unrevised estimates (apples.) Since the data are mostly oranges, your regression reflects the relationship between “final” 2Q and 3Q growth rates. However, we don’t have final 2Q growth rate estimates, we have preliminary ones (apples) that are subject to revision.
Summary: your point estimates are fine, but your standard errors (including the bootstrap ones) are too low because you’re ignoring the effects of data revision.
(Kudos to Evan Koenig for the “apples and oranges” terminology, which is the clearest exposition I’ve yet found.)
You’re right, Simon. I’m reporting the match between the revised monthly and quarterly series, which differs from the real-time contemporaneous correlation. The match between contemporaneous vintage monthly (which is all we have now for October and November 2007) and revised historical quarterly (what we’re presumably ultimately interested in) must be worse than my 80% R-squared.
Still, I’ll be surprised if the 2007:Q4 real consumption growth ends up being reported by any vintage as coming in below 1.5%
By the way, note that although I report the fit in terms of an R-squared, no coefficients have been estimated from any data.
Sure it can come in below 1.5%. December was foul and it does count. Your just mumbling possiblities and numbers.
Interesting.But CR’s method compares the quarterly average to the prior quarter and then annualizes it. So for Oct one would look at Jul and for Nov one would compare the Avg(Jul:Aug) to Avg(Oct:Nov). Or perhaps I misunderstand CR’s approach. Nonetheless I get .65% for QtoQ changes that way, 2.62% annualized and 2.64% YoY. Similarly the YoY% changes in monthly real PCE were 2.7% in Oct and 3.0% in Nov. If any of these alternatives are persuasive then perhaps your estimate might be a tad high ?
On the other hand your fundamental argument that Consumption is still holding up fairly well seems to be confirmed in at least two other ways.
BtW – if anybody’s interested prior to the PCE numbers I did a comparison of real PCE and Retail Sales and found that PCE had upticked slightly but not as much as the headlines had it and definitely ditto for retail sales. Those charts are posted.
dblwyo, I disagree. The Consumer died last spring and the stupid commerce department didn’t catch it…………again. Now they will revise to that weakness. Which is annoying.
I am on the frontlines of the consumer and the decline began last April. Some months are better than others, but the general trend has been down.
Cherry, no doubt, December was the death rattle of the consumer. Horrible month. Worst since 1991. Will leave no questions asked.
dblwyo, my calculation uses the data from BEA Table 2.8.3 as follows:
4*ln[(C_Oct+C_Nov)/(C_Jul+C_Aug)] = 4*ln[(123.652+124.327)/(122.741+123.281)] = 0.03169 or 3.169%.
My understanding was that CR would instead have calculated
{[(123.652+124.327)/(122.741+123.281)]}^4 – 1 = 0.03220 or 3.220%.
Note that any averging or annualizing appears identically in the numerator and denominator so is irrelevant for either calculation. For these purposes, my calculation and CR’s produce essentially the same number, and I didn’t notice any difference between my graph and CR’s for the earlier data. How does your graph compare with CR’s?
Yes, Q4 will certainly come in strong.
However, in 2008, a recession is all but guaranteed. The last bastion of optimism, ECRI and Laxman Acuthan, has suddenly shifted his tune.
The probability of recession in 2008 is currently 90%. The only way to avoid it is for the Fed to quickly lower rates to 3.25% or less, correcting the inverted yield curve.
“Yes, Q4 will certainly come in strong”
Actually, it can’t. The best hope is “ok”.
I’m with Sandman; we’ll have to wait until revisions to get the truth.
http://www.bea.gov/national/nipaweb/nipa_underlying/TableView.asp#Mid
‘Housing’ makes up 14% of PCEs. Real housing services is up again in November. Does that make sense in light of:
— All time high vacancy rates
— Falling nominal home prices
It does not make sense; housing services should be falling in both nominal and real terms.
BEA, you have lots of smart folks onboard; fix this problem.
Note — an important factor that the NBER Business Cycle Dating Committee monitors for recession start — real disposable personal income — turned south in November for the second consecutive month.
It seems likely that these numbers will be revised down. They usually are at this stage of the business cycle and we virtually always see them revised down later in the annual revisions.
The “final” estimate for 2004 GDP was 4.4% according to the March 2005 release. Yet now, the BEA says it rose only 3.6%.
And even if they aren’t, we will certainly see big declines in December and January.
Real disposable income is falling (0.4% lower in November compared to September) and a -0.5% savings rate is certainly not sustainable given falling house prices and stagnating stock prices.
I’ve used the Calculated Risk method for tracking real PCE in the quarterly real gdp data for years and it clearly does a good job of putting you in the right ballpark as James is doing — not withstanding all the problems with data revisions.
I don’t doubt that November’s consumer spending numbers looked strong. But the reasons aren’t economic growth.
1. Christmas shopping season had two weekends in November, and many people grabbed the Black Friday specials in large numbers. This is good if you got a nice deal, very bad if you’re a business, as it means serious profit and revenue slack in December.
2. Americans are taking out the plastic in record numbers to pay for this, and they’re not paying those balances off. Check out this article.
http://biz.yahoo.com/ap/071224/credit_card_crunch.html
The key question is when the bomb drops on all these bank and lending companies for record defaults in homes and credit cards, and the major layoffs pick up. You think you’re seeing consumer weaken in December? Wait till spring 2008.
I have posted some charts illustrating the ratio of Non-Durable Consumption relative to Durable and how it behaves into mid recession.
The level of this ratio is associated with recessions in the past.
See “Consumption: Propensity vs Ability”
only two minor comments: This was a unique season with Thanksgiving so early, retail sales growth seems to have fallen rapidly in December–cold, snowy weather and heating oil costs did not help the consumers appetite to go out and spend and sentiment conitinued to fall. Secondly, the comment that the market seems to agree about the current economy is missing the point about markets, they are discounters of expectations of the future, not a coincident indicator of current conditions nor of the recent past–besides the enormous tendency to use any excuse by professinal money managers at the end of the year to drive stocks higher–they usually do not tread water at year end..as cash flows into funds are high, hedge funds are long biased, and there is a general need to mark stocks up for performance and fees. We always try and find rationalizations for why markets over the short run do what they do–it fills a basic human need to associate the markets beahvior with some current piece of news.
If I buy everything now, but use a credit card and never pay that bill, did the transaction happen?
Or will the nonpayment just impact next quarter?
Is it me or it the bearishness on the US economy becoming almost cult like? Even slightly bullish arguments seem to generate massive hostility.
Jodie,
You are correct. There is an obsessive need among Bush-haters and anti-US Europeans to gleefully hope for any misfortune for the US economy. They are so invested in it, that a high GDP number, a high job-growth number, or even an up day for the stock market is cause for distress.
These are the same people who get happy when they see bad news from Iraq, and get sad when they see good news. It is quite a sickening cult, actually.
the hostility against bullish sentiment has been building for YEARS. rational investors are sick and tired of the supply-side garbage they’ve been force fed since 1980. the idea that markets must always go up regardless of conditions has been exposed – it’s a fraud. the bulls don’t have a leg to stand on… the stats are backward-looking and suspect at best. credit markets may never be the same again, the US housing market is in shambles, and globalization has neutered the Fed and ECB. the bears are finally having their day in the sun… they deserve it.
No, “rational” investors don’t discount EVERY single piece of data that MIGHT just POSSIBLY conspire with OTHER data to say we’re not actually rocketing toward The Imminent Destruction of the American Economy. It’s becoming almost farcical to see the arguments being employed here.
Jake,
You’ve hit upon a split that is going to prove interesting. Corporate profits fell in Q3, while GDP posted a very nice gain. The PCE data so far look quite good, but were probably bought at the cost of very narrow margins. We may see profits down again. Profits tend to be a fair indicator of corporate spending, so predictive of GDP trends.
Ray Fair’s “FAIRMODEL” was predicting 4.1% growth for Q4. It nailed Q3 growth at 3.9%.
One word that everyone should respect is “momentum”. It’s pretty unlikely that you would go from sizzling growth in one quarter to a contraction in the next.
That doesn’t mean we won’t have weaker growth in Q4 than in Q3. But I said in another post to Menzie that Q4 growth would be closer to 3.9% than the 1.4% he predicted from a meta-analysis of others’ predictions. I was basing that on momentum and the FAIRMODEL prediction.
So… again, based on momentum, JDH’s analysis should also be pretty accurate. If 2 of the 3 months are predicting ~3% growth, it’s pretty unlikely that Q4 will be negative.
Also, the 10 year is back up to ~4.25% from its low below 4%. Is that a recession signal?
Recessions are inveitable. It’s part of our unpredictable economic cycle. Plan for the worst, hope for the best.
Buzzcut,
I don’t know that the FAIR model is all that accurate, quarter to quarter. The Q3 call may simply be a case of bling squirrel. Do you have evidence on the FAIR model’s record?
I would also point out that your momentum argument isn’t supported by the data. There are many instances of swings from above trend growth in one quarter to contraction in the next over the past several decades. Just a few examples before I get back to work.
1958 Q1 10.9%
Q2 -0.3%
1960 Q1 9.2%
Q2 -2.0%
1970 Q3 3.6%
Q2 -4.6%
1973 Q2 4.7%
Q3 -2.1%
Q4 3.9%
1974 Q1 -3.4%
1981 Q1 8.4%
Q2 -3.1%
I didn’t continue looking past 1981.
Where did you get that data, kharris? I’d like to see post-1981 data (after “The Great Moderation”).
I don’t necessarily disagree about the blind squirrel, but we could say the same thing about any predicition.
The Fairmodel has been around since the ’70s, and has been updated steadily since. Like any macromodel, it’s probably not the most accurate thing in the world, that’s why macromodels aren’t all that popular anymore.
But at least you have SOME basis for making a prediction with the Fairmodel. And it’s open source, so if you are really interested, you can download the “source code” for the model and figure out how it works along with all the documentation at Ray Fair’s website. If you don’t like the assumptions, you can change them and re-run the equation.
Buzz,
GDP data are available in convenient tabular form – several different presentations – at economagic.com. Economagic is a commercial vendor of official data, and I have never found them to be in error.
The reason I asked about Ray Fair’s model is that it has gotten more than its share of bad press from other model builders. I’m not in the business of building multi-equation models myself, so I only know what I read. I do know, however, that varying the assumptions comes in a variety of flavors. At some structural level, the model is the model. If it performs less well than other big strutural models, they you may not be able to get around the problem. There is also the problem that, to anybody who has much sophistication in economics, varying the assumptions can amount to a way to build in one’s own bias about the outcome. I’m all in favor of running a wide range of assumptions in this kind of exercise, but I am leery of analysis that starts out by changing assumptions the analyst doesn’t like. Varying the assumptions should be an exercise is seeing what the range of possibilities is, based on the current state of affairs. The question is – given where we started – what is the likely range of outcomes? Varying assumptions should be a test of the “given where we started” bit, rather than an exercise in picking comfortable assumptions.
All of which is a long-winded way of saying that I’m not sure the user-friendly aspects of the FAIR model gets me around my concern that it may mislead us about the future to a greater extent than some other forecasting methods.
Buzz,
Good point about the Great Moderation. Shoulda thought of that and started where I finished. In a hurry, I guess.
All of which is a long-winded way of saying that I’m not sure the user-friendly aspects of the FAIR model gets me around my concern that it may mislead us about the future to a greater extent than some other forecasting methods.
That’s fine, but what are the other forcasting methods?
Menzie’s way was to meta-analyze all the other forcasts. He gave a mean and a standard deviation. Is that more accurate than Fairmodel?
Maybe you prefer the betting markets?
The most interesting recent data was:
2000 Q1 1.0
2000 Q2 6.4
2000 Q3 -0.5
2000 Q 2.1
That drop of 7% from Q2 2000 to Q3 was pretty dramatic.
Other than that, it’s pretty darn steady. Slow and steady growth.
Buzz,
The thing that is missing from the data since 2000 is a quarter of declining output. Absent such a quarter, we can’t know whether the prior quarter’s growth was strong or weak.
Just squinting at the data, I think there are a couple of patterns. One is that iventory swings are a frequent cause of big swings between quarters. If that is not associated with a slowdown in final demand, then there may not be a subsequent quarter of slow growth. In Q3 of 2000, for instance, inventories were a 5.95% drag on GDP growth. All but 1% of the slowdown you cite is due to inventories.
The other pattern is more of what you had in mind, I think. There are a number of instances of gradual slowing. However, as long as we have inventories and financial excesses, the notion of momentum protecting us from a slowdown may not work out.
As to forecasting approaches, I know of just two that extend beyond whatever period one is in. One is models, the other is indicators. The ECRI us growth index, for instance, is now showing the fastest slowdown since 2001.
Taking my exception into account – whatever period you happen to be in – John Kitchen maintained the current GDP assessment that he started under Treasury Secretary O’Neill for some time, but I no longer find a recent estimate on his web page
http://users.starpower.net/jkitch/#current
Apparently, that’s because it takes a very long time to run the model. Or maybe it stopped working, as models tend to do. In theory, though, it should always work, because it is pretty close to an accounting model, ratehr than a forecasting model.