I’ve been invited to give the keynote lecture at the Society for Nonlinear Dynamics and Econometrics Annual Symposium next week at the Federal Reserve Bank of San Francisco. I plan on presenting results of some ongoing research with Mike Owyang of the Federal Reserve Bank of St. Louis on regional propagation of business cycles. This is the first of two posts that describe some of our findings about how recessions differ and seem to propagate across different states and regions.
The building block for this research is the same basic framework used to characterize expansions and contractions by the Econbrowser recession probability index. While that index is based on quarterly national GDP growth, Mike and I are looking instead at the quarterly growth rate of employment at the level of individual states. Our starting point was to replicate and update the results from an earlier paper, Business Cycle Phases in U.S. States, which Mike published with Jeremy Piger and Howard Wall in the Review of Economics and Statistics in 2005. The original Owyang, Piger and Wall piece essentially just implemented for state-level employment growth the same algorithm that I apply to quarterly GDP to get the regularly reported Econbrowser recession probability index. They conducted this analysis on each state individually, one at a time, without trying to use information from other states.
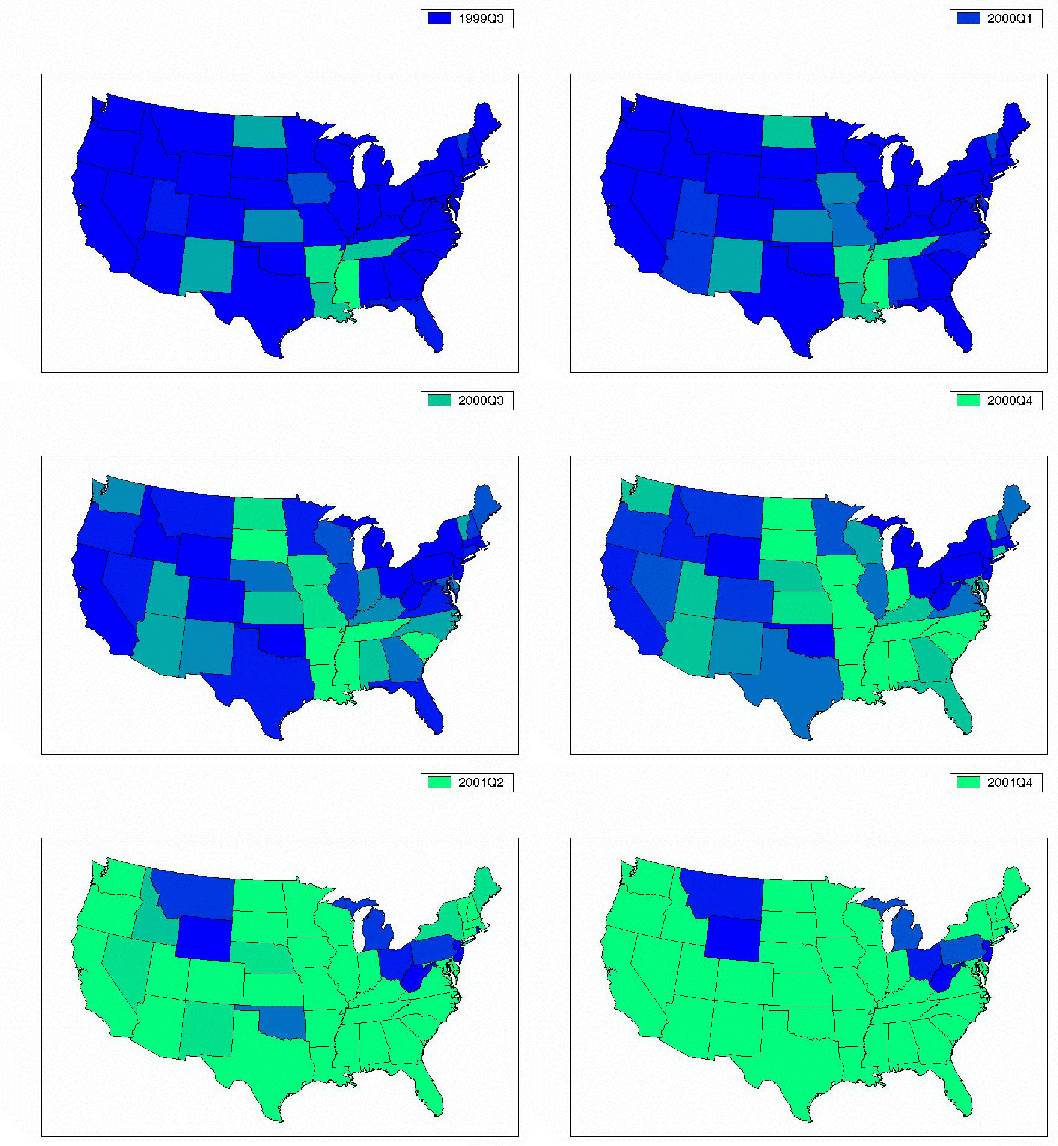
What one finds in that exercise is that recessions and individual states can look pretty different from each other. For example, the graph below displays the recession probabilities for individual states around the time of the most recent recession. Dark blue indicates strong evidence of expansion, while the brighter the shade of green, the stronger is the statistical confidence that the indicated state was in recession at that time. The figure dynamically displays the changes between 1999:Q3 and 2001:Q4 (and yes, I’m proud of myself for figuring out how to create these pictures).

What one sees in that episode is some initial weakness in the lower Mississippi basin, which had spread throughout the southeast and much of the upper Mississippi by 2000:Q4. Remember that, according to the NBER, the recession did not begin at the national level until 2001:Q1. As 2001 progressed it came to affect almost every state, though a few states in the Midwest and Rocky Mountains seem to have avoided it, even at the 2001:Q3 trough.
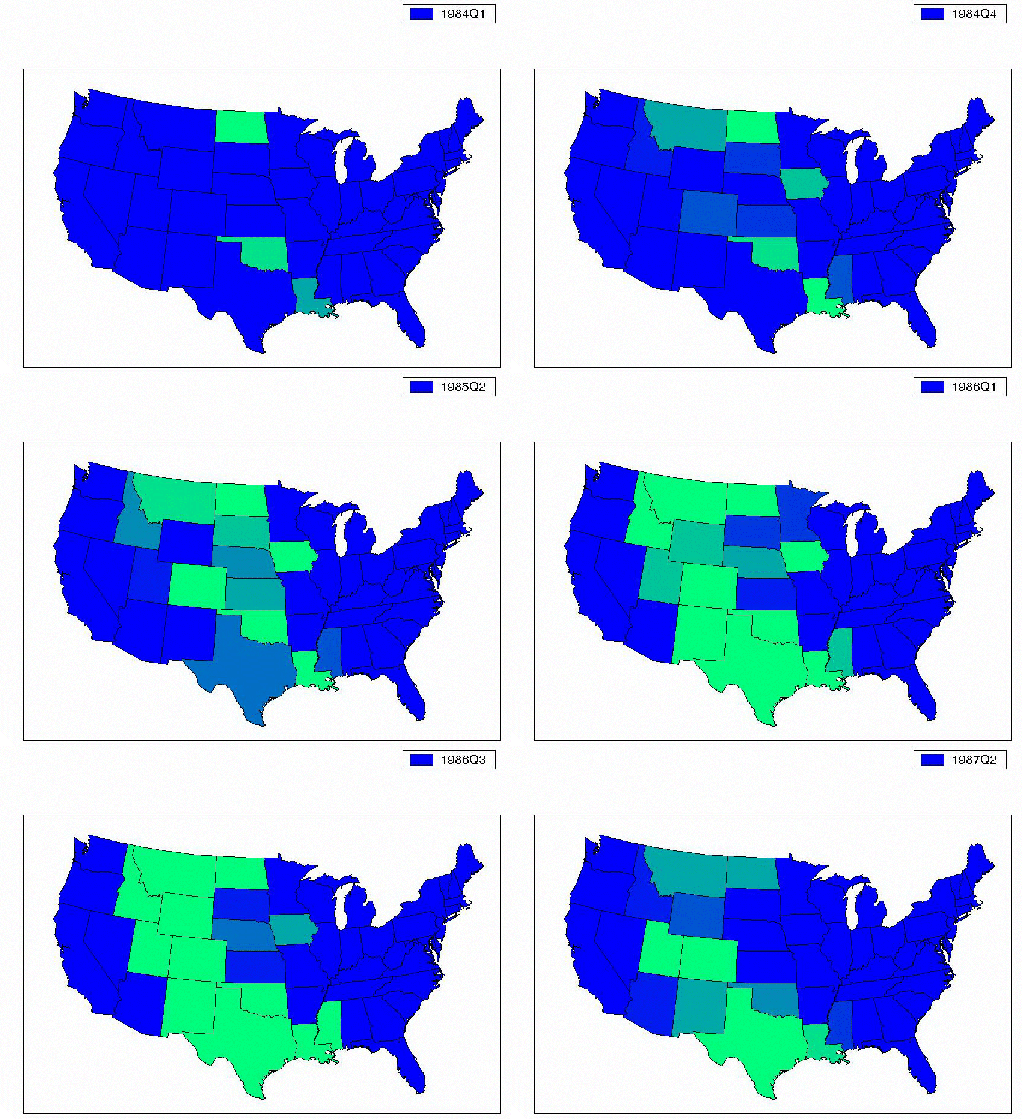
On the other hand, there are other interesting episodes such as 1985, when the collapse in world oil prices produced a boom for most of the U.S., but shows up as a regional recession in the key oil-producing states (such as Louisiana, Oklahoma, North Dakota, Texas, and Montana) which later spread to their immediate neighbors.
The intriguing thing about these pictures is that they seem to suggest some clear patterns and relations between the states, even though there was no assumption of any such structure in the estimation, which ignored everything about Louisiana in forming an inference about Texas. Mike and I have been looking at a broader statistical characterization of how the recessions in different states appear to interact with each other, using the full panel of data from all 48 contiguous states to form an inference about what is going in any given state at any given date. Next week I’ll describe how we did that and some of what we found.

Jim,
Very cool. And thanks for putting this up. I shall be at the conference, but will probably miss your talk because of having to meet some family members arriving at the airport to spend the weekend.
Very cool indeed. And not just the graphics.
I’ll third the “very cool!” You know, if you ever thought about podcasting or video, your upcoming presentation would be an almost guaranteed hit.
Thanks, Ironman. I believe the conference organizers are planning to do an interview there that should be available online.
It would really be interesting to see the information from 1999-2008. I suspect you would find the industrial north in a chronic malaise if not recession.
“Outsourcing” and “globalization” have been responsible for a discrete level shift in manufacturing output for the domestic automotive and related industries in those areas and, I believe, the influx of foreign-owned assembly plants has not replaced the entire domestic chain that has been collapsing.
I can only guess that there are some underlying currents in other economic sectors that have similar dynamics.
I wonder why Louisiana would be the first to go. Less freight activity?
JB,
I’m just guessing here but I suspect the issue with Louisiana is that they likely had less other industry relative to the size of their oil industry.
That would make a shock in their main industry (oil and gas) felt in negative GDP much faster than elsewhere, with the other states needing a deeper oil drop to overcome upward GDP forcings from the rest of their economy and move the overall state into recession.
Those are very informative animations! It would be interesting to see the pattern for coming out of the recession, whether it is the mirror of going in, or perhaps the states that led the way into the recession also led the way out, or something else.
It really raises the question of how many different styles of recession there are (only 2?) and whether earlier signals are available for prediction.
That was really interesting to see. I knew oil was big in western North Dakota. I didn’t realize it was that big back at that time. I should’ve though as oil is a big driver in ND’s current budget surplus of $200 million.
Did you try to test nucleation of inflation waves through the US with the same technique?
It would be interesting to see if there is a correlation between state recessions and congressional action. This could be done by finding the major products of a state and then review what legislation inmpacted that product. Just considering the oil depression of the 1980s there was much legislation that was generated during the 1970s that impacted the oil producers in the 1980s. Negative legislation should also be included such as restrictions on oil exploration and exploitation.
Kio: I have not looked at inflation in this way.
Ironman: It turns out my lecture in San Francisco will be taped and available.
I’d feel pretty proud if I could do up those pictures too!
I would expect that the pattern with inflation repeats that for unemployment. Inflation in the center of the USA should be higher due to lower per capita income and leading price growth in cheap goods and services. By my extimates, inflation in the USA leads unemployment by 2.5 years. it would be interesting to compare corresponding waves in space and time.