More outstanding analysis from Calculated Risk.
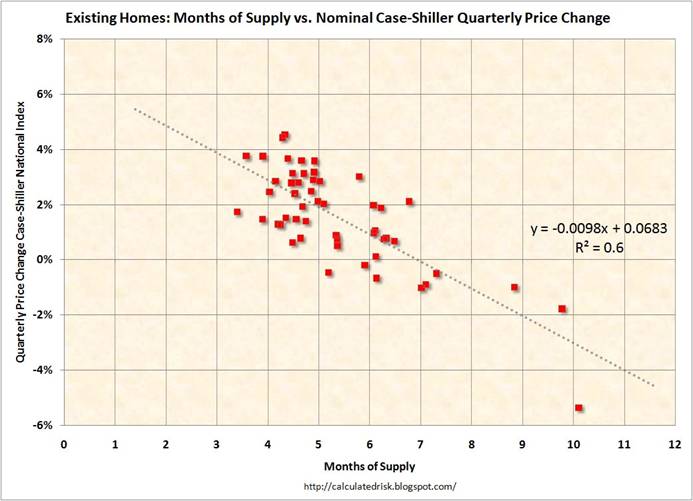
CR gives us this scatter diagram fit to data from 1994:Q1 to 2007:Q4. The horizontal axis plots the inventory of existing homes for sale on the market, while the vertical axis gives the quarterly change in the nominal Case-Shiller National Home Price index. The strong negative correlation in the data is not something we’d expect to see in a frictionless market such as stock prices, in which a change in fundamentals would translate almost instantly in a sharp drop in price to the new equilibrium value, from which further changes in the stock price would be unpredictable. The reason for the gradual and predictable changes we see in house prices is that if a homeowner is mistakenly too hopeful about what their house can sell for, there is no one to arbitrage away the error, and the home just sits on the market unsold until reality finally sinks in.
|
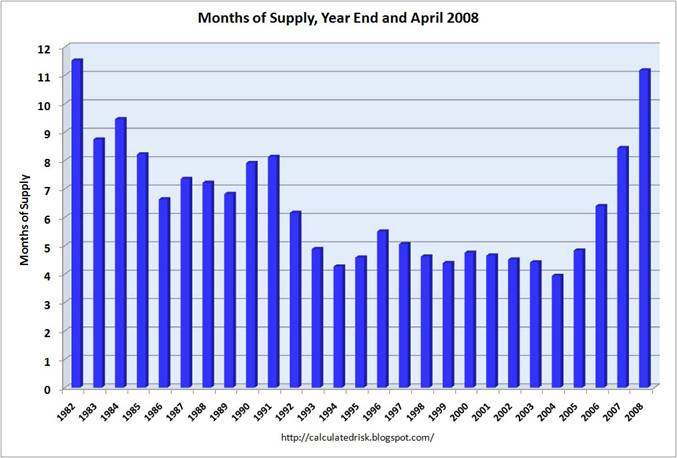
Thus as the inventory of unsold homes has continued to build, the decline in house prices has been fairly predictable. With the inventory of unsold homes averaging 9.9 months for 2008:Q1, CR predicted a quarterly decline in the Case-Shiller house price index of 3.1%. The actual number released today was a decline of 6.7%. If the 11.2 months of inventory figure for April is repeated in May and June, CR’s regression would predict another 4.1% decline in 2008:Q2.
|
The significance of all this is that the magnitude of subsequent declines in house prices is probably the single most important determinant of how many more homes end up in foreclosure. That in turn will determine how widespread the failures of major financial institutions become.
This has been like watching a train wreck in slow motion.
Technorati Tags:
macroeconomics,
housing,
house prices,
Case Shiller price index
Jim, you write, “The reason for the gradual and predictable changes we see in house prices is that if a homeowner is mistakenly too hopeful about what their house can sell for, there is no one to arbitrage away the error, and the home just sits on the market unsold until reality finally sinks in.” I understand how this argument applies when prices are falling, but rising prices appear equally predictable. Why don’t price jump in a tight market? Are sellers mistakenly pessimistic?
John L.
Just guessing. Many sellers have a goal or deadline in mind. They want the equity from the old home to provide equity for a new one. They have to be in Tallahassee by August for the new job. Once they are past the point that the goal or deadline is satisfied, they have a reduced incentive to hold out for a better price. Not pessimissm, but practicality.
I’d be interested to see how much of the price decline is due to foreclosures and trashouts being dumped on the market at fire sale prices. Because house price declines tend to be clustered, there can be a cascade effect, forcing prices well below equilibrium.
I’ll offer another point : Otherwise intelligent people who are quite aware of the concept of inflation seem to miraculously forget about it once the price of their own home enters a discussion.
Thus, they believe things like : “The price may not rise, but at least it won’t go down.” Not realizing that a flat price for 5 years is indeed a huge loss when cost of capital is taken into account. At 5% CoC, you have lost 27% in 5 years. At 8%, you have lost 44% in 5 years.
Thus, people have a fixed price in mind, below which they will not sell. The house sits there for a year or two or three, until inflation/wages/purchasing power catches up, and it finally sells a the same nominal price. The buyer is thus ‘happy’ that he got his price by waiting, without thinking about the opportunity cost of CoC over those 2 or 3 years.
A second point is : when talking about their homes, otherwise smart people tend to forget about the difference between *high* prices and *rising* prices. A good school district may justify a *high* price, but it is the same school as it was 2 years ago, so why should the price *rise*, any faster than wages rose?
Another point on the ‘months of supply’ point is that it was low when Baby Boomers were in their peak home-buying years, 1986-2005. Now, as the interest rate-driven bubble unwinds by 2011, that also coincides with the point where more Baby boomers are sellers (going into retirement, etc.), while none are new/upgrading buyers. This bodes poorly for homeowners even in the 2011-2020 period. It is great, however, for any young first-time buyers in 2011-2020. Perhaps the housing bust will lead to a revival of childbirth and fertility rates, once more.
-Jim,
I respectfully don’t agree with your implicit assumption that the linear regression holds at the extreme inventory levels we are currently seeing. The available data beyond eight months is sparse relative to the total number of points. In the four to eight month range, we can confidently predict that change is linearly correlated with a confidence interval of about 2%. However, we shouldn’t necessarily expect that relationship to hold in the high inventory regime. The three available data points shown (four as of today in CR’s updated post) actually may suggest the declines become more severe at these high inventory levels.
Regardless, if we took the data and drew the 95% confidence intervals in the linear regression, the uncertainty at these higher levels would be large, and the linear regression would show significantly less predictive power than your 4.1% decline would suggest. Perhaps you could revise it to
4.1 +/- 4% to better reflect that uncertainty without actually running the stats.
To make an already sobering chart even more sobering: In 1982, the last year with more months’ supply of unsold homes, the average 30-year mortgage rate was a purchaser-deterring 16.08 percent.
Perhaps I show my age, but it is amazing to me how well the data confirms Samuelson’s price adjustment mechanism:
delta P = lambda(Qd – Qs)
What the data says is that lambda isn’t very large for housing.
Yes, in some special cases Samuelson’s formulas almost look like the real world. How many lambdas does it take to make a good meal anyway?
I’m not sure where John Leahy lives, but prices do indeed jump in a “tight” (the quote marks are to indicate that tight may be, and often is, a perception rather than a reality) market. Did he happen to see what happened w/ RE prices in many parts of the country over the last five years?
Also, it is worth noting that, while optimism can cause you to seek a higher price, it is not pessimism, but realism, that gets you to start with, or accept, a lower one.
The restraint on the price jump in a tight market is the effect of borrowed money; the lender wants to see an appraisal that states the value is enough to protect them. Appraisals lag the market. And now that purchase prices are absurd multiples of the buyers net worth, the time to acquire the down payment also slows the price rise.
The disregard of substantive appraisals and elimination of the down payment requirement, combined with exploding loan terms, fueled the gains in the home market that are now vanishing.