Or, is the model for explaining why macro data sometimes appear so counter to intuition best explained by willful deception (Iraq and WMDs), incompetence (the FEMA response to Katrina), or prosaic (resource constraints)? The casual reader might think I’m overstating the extreme hypotheses, but there is, after all, a whole website devoted to the proposition of conspiracy:
Have you ever wondered why the CPI, GDP and employment numbers run counter to your personal and business experiences? The problem lies in biased and often-manipulated government reporting.
Here’s John Williams’ exhibit 1 in the case against the government:
Figure 1, drawn from John Williams’ “Shadow Government Statistics” website.
The other extreme view holds that incompetence is the problem. (This blogger does not use the word, but the adjective seems implicit in the discussion).
Personally, I think that many of these shortcomings in the data series reported by the government are a function of how well funded the agencies are, the priority accorded good data collection by the highest levels of the government (clearly, if no premium is placed upon the usefulness of information, then there will be little inclination to push for innovation in data collection), and the requisites of timeliness.
(Parenthetically, I won’t deny that sometimes, the level of management seems FEMA-esque, as in the recent attempt to digitize the next Census. But I am hopeful the next administration will put in better management.)
On the first point, I’ve already noted how funding has been declining for the various statistical agencies. [1].
How does this debate reflect upon the current debate over the economy’s state? At the time of the last recession, note that GDP was recording positive growth. It was only after some revisions did it become apparent that GDP growth had slipped into the negative region. And even later, subsequent estimates indicated that the growth rate had not gone negative for two consecutive quarters. I reprise the below graph to illustrate this point.
Figure 2: Real GDP growth in Ch.1996$, q/q (in log terms) from May 2001 vintage (blue) and May 2006 (red). Source: BEA via FREDII and ALFRED, and author’s calculations.
To highlight the challenges faced in terms of generating timely estimates of GDP, consider the nature of the data used to calculate GDP. Figure 1, drawn from Chart 1 of Arnold Katz’s “An Overview of BEA’s Source Data and Estimating Methods for Quarterly GDP” (BEA, November 2006) [pdf] shows the type of data used to generate the advance and preliminary GDP releases. Note the large amounts of “trend-based” data used particularly in the advance release. Fully 55% is “trend based” and “trend based and monthly data” in the advance, dropping to 24.2% in the preliminary.
Figure 3: drawn from Chart 1 of Arnold Katz’s “An Overview of BEA’s Source Data and Estimating Methods for Quarterly GDP” (BEA, November 2006) [pdf].
The final vintage exhibits substantially little change — in terms of the types of data — relative to the preliminary vintage. What one does see is that in the annual revision, usually released in July of each year, a lot of additional information is incorporated. So the time profile of GDP could change yet again as more information is released.
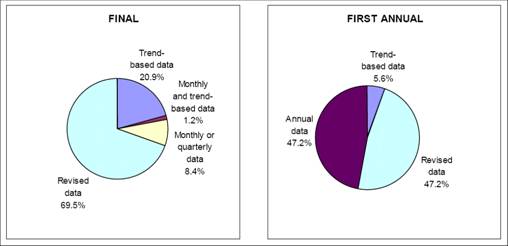
Figure 4: drawn from Chart 1 of Arnold Katz’s “An Overview of BEA’s Source Data and Estimating Methods for Quarterly GDP” (BEA, November 2006) [pdf].
As noted in this document:
The source data that BEA uses are collected from a variety of sources and, with few exceptions, for purposes other than the preparation of BEA’s estimates. Data collected by Federal Government agencies provide the backbone of the estimates; these data are supplemented by data from trade associations, businesses, international organizations, and other sources. The Government data are from a number of agencies, mainly the Commerce Department’s Bureau of the Census, the Labor Department’s Bureau of Labor Statistics, the Internal Revenue Service and other agencies of the Treasury Department, the Office of Management and Budget, and the Agriculture Department. Some of the Government-collected data, referred to as “administrative” data, are byproducts of government functions such as education programs, tax collection, defense, and regulation. Nonadministrative data, sometimes referred to as “general purpose” or “statistical” data, include the periodic economic and population censuses and a wide range of sample surveys, such as those that collect data on manufacturing, farm activity, and prices. Of the relatively few data items that BEA collects, most refer to international transactions. These include international trade in services and direct investment (both by foreign residents in the United States and by U.S. residents in foreign countries).
The source data available to BEA are not always ideal from the point of view of preparing the national economic accounts. BEA must develop estimating methods to transform the data. The estimating methods adjust the best available data to the concepts needed for the accounts, fill gaps in coverage of the source data, and make adjustments to the source data to obtain the needed time of recording and valuation.
I think this places into context some of the trade-offs that have to be made when trying to generate estimates of GDP (and its components) fairly quickly after the end of the relevant time period. Inspection of, for instance, the consumption block, highlights how much of the data are trend-like in the first couple of announcements:
Table 1: drawn from Arnold Katz’s “An Overview of BEA’s Source Data and Estimating Methods for Quarterly GDP” (BEA, November 2006) [pdf].
In any case, I think these are points that need to be kept in mind as one takes the most recent GDP numbers, and makes flat out statements that we are — or are not — in a recession. (Egregious example here.)
Now what about the conspiracy view, that says the government is systematically fudging the numbers to minimize inflation. I think there are two questions to be addressed. The first is whether the older approach is “better” than the newer approach, which incorporates hedonics and allows for changes in basket weights. The second is whether the changes in methodology over time invalidates intertemporal comparisons of inflation rates. I think the case for an affirmative is somewhat stronger in the second than the first, although even in the second case, there are “fixes” to the problem.
As mentioned before, on the SGS website, and you’ll see assertions about how the government has manipulated the CPI over time, so that if one calculated inflation using CPIs calculated as they were pre-Boskin Commission, then one would obtain higher inflation rates. I don’t doubt this specific assertion, although without having all the spreadsheets, I can’t verify it (the issue of whether this is all intentional, well, WMD/Iraq does give one pause for thought, but I still am skeptical). But the fact that there might be different biases at different times in the data series doesn’t mean that ignoring quality changes in the past was a good thing. On the other hand, it’s hard to adjust to take out the quality changes in the past. But if one were concerned about this specific issue, one could use the experimental research CPI series calculated by BLS (documentation here).
Figure 5: 12-month inflation CPI-all urban (blue) and research series CPI-all urban (red), calculated using 12 month log-differencing. Source: BLS and author’s calculations. Documentation for research series here.
On the first issue, however, it does seem to me that one does want to adjust for quality changes.
Now what is true is that the RS series does not hold fixed the weights — so the weights change in this series in 1987 and 1998. But the question that needs to be asked is whether one should hold weights fixed at, say, their 1982-84 levels, when trying to assess the inflation rate in 2007. I think the answer is no, and the reason goes to substitution effects. As relative prices change, consumers substitute away from the relatively expensive items. Holding fixed the weights overstates inflation. Of course, using the new expenditure shares as weights understates inflation. There is no really correct measure (unless one knows some very specific things about the consumer utility function), just as one can’t say that Paasche is “better” than Laspeyres.
So, if it’s not conspiracy, and it’s not incompetence, but it’s resource constraints, then what’s to be done? First, and easiest, we all have to be more careful consumers of data. In particular, one needs to understand the preliminary nature of the data. Second, more difficult, one needs to fund the collection and analysis of data more fully. Because there is no natural interest group constituency for data collection, I doubt this will occur easily. It certainly will not occur if those at the very top value dogma over data.
Parting shot: Looking at the latest data, note that while GDP growth (q/q, log terms) in 2008Q1 is greater than zero, it is perilously close to 0. And it is less than the corresponding value for 2001Q1 reported in May 2001, which eventually turned out to be negative. That’s not conspiracy — that’s an outcome of constraints — some unavoidable, some a function of funding choices.
Figure 6: Real GDP growth in Ch.2000$, q/q at at annualized rate, calculated in log-differences. Source: BEA, GDP release of 26 June 2008.
To the extent that quality is reliability, then changes should show up in future repair costs. No need to bring it forward in the accounting.
To the extent that quality is just vaguely “better” we should probably just pick our household, and still go with their basket of goods. Use a second quintile family and assume that there aren’t too many luxuriously better goods in there.
(In an affluent society median family expenditure is probably populated with small luxuries.)
That the CPI is a politically rigged fiction is made obvious by the way it treats major inflationary items. When housing prices began to rise rapidly, they were removed and a fictitious “equivalent rent” substituted. When food and energy began to explode, they were removed and the balance called “core inflation.” Geometric, rather than arithmetic, means are used in many calculations because they minimize high values and emphasize low ones. The vast array of substitution and quality adjustments are used to minimize actual increases.
People should be aware that the government has strong motives for causing as much inflation as possible while reporting it to be as small as possible.
1. The government taxes inflation. If you have 100,000 investments and the real value falls by 2%, the government collects nothing in taxes. But if at the same time, the government causes 10% inflation, then the nominal value of the 100,000 becomes 108,000 and the government can collect taxes on the 8,000 in nominal gains even when the real value has been reduced. Capital gain taxes have no inflation adjustment.
2. Inflation causes bracket creep. People are pushed into higher tax brackets and subjected to higher income taxes without a congressional vote. Non-alternative minimum taxes are adjusted by inflation, but if the government statistics only report inflation has half of its actual number, then peoples nominal income will rise faster than the tax bracket adjustments.
3. Inflation allows the government to reduce social security benefits. Social security benefits are adjusted for inflation, but if inflation is underreported, then the government can reduce its spending burden without passing anything through congress or even telling the recipients.
4. The US federal government is the worlds biggest debtor and by creating inflation it can reduce its debt burden. By underreporting inflation it can trick markets into providing lower interest rates for its treasury bonds. Most people know this which is why it is foreign governments rather than private individuals which buy treasury bonds.
I am not saying that this is proof the government underreports inflation. I am just laying out the case that the government has motive to both cause inflation and underreport inflation. Since the government has taken control of the money supply by the creation of the federal reserve, the US dollar has lost 96 of its value. Before the creation of the FED the dollar maintained its value for over 100 years. This is not a coincidence.
Inflation is under-stated by more 1% meaning GDP is over stated by 1% if you understand that we have been in a recession for 6 month with government number. Because of this and other things-such as the energy crisis-stocks will go down. The economy is going to by weak until the United States takes care of its biggest problem. One billionaire calls our biggest problem the Largest transfer of wealth in the history of mankind. Find out who said it and how we correct it @
http://www.theinvestingspeculator.com
Jeffrey Knoll:
Essentially everyone knows all of this.
Which returns us to Menzie’s question of what to do about it.
The answer seems to be, for many, that if you cannot trust the counterparty then do not do business with it.
In other words, get out of the dollar and into commodities.
“But the question that needs to be asked is whether one should hold weights fixed at, say, their 1982-84 levels, when trying to assess the inflation rate in 2007. I think the answer is no, and the reason goes to substitution effects.”
i disagree, the substitution effect is probably the most insidious of the changes made to cpi. I understand changes need to be made when the consumers desired basket of goods changes due to preferences (i.e., autos instead of horse buggies), but not when the desired basket does not change. For example, I prefer filet mignon but its price becomes too high so I have to switch to hamburger. My standard of living has just been lowered, which is masked by the substitution effect. Substitution may also put another more subtle downward pressure on the CPI based on the timing of when goods are changed. If consumers switch away from filet mignon then it is likely that its price will drop and hamburger will start to rise due to increased demand. Depending upon the timing when the basket is changed back and forth, the decline in filet mignon prices will lower CPI. It all depends upon what people expect from CPI. I argue that it should reflect our desired standard of living not the changes in consumption we have to make because of government fiat.
Menzie,
Great topic. Unfortunately I couldn’t get all the way through it due to your blatent bias on political matters. Is it asking too much to keep partisan politics out of this blog? We get it, we know you don’t like the current administration. There is no need to keep inserting jabs where it has nothing to do with economics or policy.
GWG: Thanks. Is it “blatent bias” [sic] when the charges are true? Isn’t it then a statement of fact? Did not the Administration cherry pick intelligence in the run-up to the war, and did not FEMA fail in responding to the Katrina disaster, by almost any reasonable standards of judgment? Was the management of the bidding process for the upcoming Census ideal?
Please feel free to avoid those posts that offend your sensitivities in this regard.
This Williams guy seems to be a bit of a madman. I recall looking at the Shadow Stats website some time ago. In “eyeballing” his adjusted real GDP numbers year-on-year for the last 20 years or so, I calculated that he must reach a conclusion along the following lines: real GDP per capita has declined by more than 10%. In essence, we are much worse off now than we were a couple of decades ago. It doesn’t make any sense to me…
Menzie Chinn:
I have to strongly disagree. If only the price of beef goes up, and people therefore switch to the cheaper chicken meat, that does not suddenly mean that inflation didn’t happen. The people are switching to a lower-ranked preference, and to record only the price of the safe haven they’ve scurried to doesn’t just err on the wrong side — it deletes the very phenomena that are supposed to be captured in inflation metrics: whether people’s dollars buy lower-valued stuff!
Taken to the extreme, if the country plunges into a famine due to a horrid inability to produce food, and people switch to eating a kind of enriched dirt (as people resort to in Cuba and Haiti), your reasoning would tolerate showing only small inflation because, gosh, people sure don’t like chicken any more — dirt seems to be the big thing now, and prices there are sure low!
I would also add that hedonic adjustment is acceptable, but it needs to be done consistently: don’t just look at the gains in quality, but rather, look at the losses too. For example, I’ve noticed product packaging getting flimsier and thus harder to grip, and this needs to be accounted for. (I haven’t read deeply into the methodology, but my spidey since tells me this stuff doesn’t show up. Likewise, there’s the example bandied around about how the Toyota Corolla is a tad cheaper with better features, but aren’t salesmen still pocketing this gain with their primitive bargaining system?)
Menzie,
Very nice post! I didn’t realize the large portion of trend-based estimates in earlier GDP releases. I have been puzzled by these GDP numbers for a while: surveys of consumer and business confidences are lower than I’ve ever seen, unemployment rate has gone up a full percentage point in the past year, yet we keep on getting these positive GDP reports — I can’t make sense of them. Your post seems to suggest that if one thinks we are deviating from the trend, like right now, one should put less weight on these positive quarterly GDP releases, right?
Separately, I am a bit tired of many complaints about CPI (eg. Warren’s above): it’s not that CPI is perfect, it’s just people who complain about it often turn out to have put less thoughts on the subject than BLS. For example, how many people who complain about the concept of “owners’ equivalent rent” understand that if one replaces it with “user cost”, the inflation rate in housing will actually be negative in a housing boom?! Another example is geometric average versus arithmetic average: the case should be straightforward: if milk price rose from $2 to $3 in one market but fell from $3 to $2 in another market, the average price was unchanged and so was the geometric average, but the arithmetic average would have concluded there was a price increase!
Menzie, this is a great topic and I agree with you that declining funding is a primary problem.
I do want to point out a few things:
1. There has been heavy-handed manipulation of governmental reports by the Bush Administration. The recent report of outright censorship of testimony by the VP’s office makes it clear that we should trust nothing we are told. Further, perception manipulation at lower levels dates back at least to Lyndon Johnson and the unified budget. This Administration may be (is) Stalinist in the way it does it, but they’re hardly the first.
2. Jeffrey Knoll’s point that there are political advantages to certain kinds of data distortion and not to others is clearly correct. Whether it happens or not is debatable, but I would point to the dustups over Social Security and Medicare as examples of the political process creeping into the analytical tent. “We’re not cutting your Medicare, just the services you will receive,” for example.
3. On substitution, people may substitute dog food for prime rib, but they are not the same. Some of the hedonic substitution that is done is clearly in that category.
4. I would suggest that the best way to judge the accuracy of data is to see whether they fit a consistent picture. For example, a declining savings rate is not consistent with a stable or rising family income. When one puts together the many pieces of the American mosaic, one sees declining standards of living in all but a few areas (e.g., longevity, e.g., living space/person). While there are many potential explanations, the simplest is that inflation is being mismeasured.
In other news, 550 metric tons of yellowcake uranium have been moved from Iraq to Canada. (What was Saddam going to do with that?)
In non news, there is no news to report about FEMA. Yes, there is serious flooding in the Midwest but, the local and state governments are competent, and the people are recovering. FEMA is on the ground everywhere helping with damage assessments and relief but, since there isn’t anything to use against President Bush, there isn’t any news reported about FEMA.
Often I think people just put too much faith in the data. The data is good, and the professionals do the best job they can and they obviously need more resources. But do not get too excited about minor errors. Overall we are saved by the law of large numbers that the errors probably offset and the data does a good job of capturing the underlying trends and changes in trend.
My favorite data story is the US- Canadian trade data. Trade data should be about the best data– it is essentially a 100% sample and because the government collects tariffs on imports it has an incentive to do a good job of collecting import data. Second, Canada and US both have top notch data collection agencies that do a good job.
Consequently, the US-Canadian trade data should be among the best in the world — there isn’t even the big time lag problem on trade data between many other countries.
But both countries report that they run a large trade deficit with each other. They finally resolved the issue by agreeing that each would use the other country’s import data as their export data.
The problem stems largely from two sources. One, both countries do a better job of collecting data on imports than exports so they both tend to under report exports. But the biggest issue may be transfer pricing. The bulk of US-Canadian trade is intra-company trade as a firm trades with its branch in the other country. But this mean the prices are not arms length transactions and are often seriously mis-reported so as to avoid or minimize taxes on profits.
The political argument about the data we see isn’t what really bothers me. What really bothers me is that so much of the academic economic research seems to ignore the unreliability of the data and regularly uses econometric techniques that really should not to be trusted because of the data problems.
(Parenthetically, I won’t deny that sometimes, the level of management seems FEMA-esque, as in the recent attempt to digitize the next Census. But I am hopeful the next administration will put in better management.)
Well, you’ll probably get your wish, but I don’t think that the people doing the management are the problem. And since the people doing the work don’t change… and since they’re unionized, really can’t change… you’re wish is pretty unlikely to result in better stats.
Thanks spencer, thats what I was thinking.
Don’t forget that the actual work in producing these numbers is turned in by a large number of middle class Americans from across the country, each facing political pressure from their own neighborhood [select one: moonbat/neocon].
With the closeness of two presidential elections, I believe the biases probably cancel. As to the mutual benefits of big government for the two teams, I suspect loyalty goes: self; constituents; party; nation.
I don’t see enough personal gain for such a far reaching conspiracy.
Most of the changes that have been made to the US inflation index are not unreasonable individually, but it does seem from reading the report of the Boskin commission that they were looking for changes that would lower the reported rate of inflation. For example, why an adjustment for the introduction of new products, but not the demise of old ones? Maybe what the US needs is an independent-of-government, Supreme Court style government statistics authority to maintain their integrity.
Menzie,
Thanks for making such a strong case against central planning. It is clear from your stats that the government is not prepared to run our lives because the will engage in policial manipulation and demonstrate a very high level of incompetence.
Thanks for an overall good article. Its interesting to see how long it takes for the data to settle down.
I disagree, as others have, about hedonic adjustments. This is what happens when bureaucrats grade their own papers. I strongly suspect that if this were put up to a vote, citizens would overwhelmingly vote for a CPI based on a basket of goods that stays constant for some long period (but maybe not forever because we have stopped buying buggy whips).
Lastly, in your comments on GDP growth, you should have mentioned the false information that comes out of the birth/death model of jobs. Though mathematical and consistent, it clearly pumps out a false picture of US job growth. The home construction industry has not been growing jobs during the past few months, despite what the Labor Dept. reports. We would be better off if we agreed that small business jobs cannot be tracked monthly, and the monthly job report should contain only jobs in medium and large companies where real data can be tracked on a monthly cycle. Annually, some quarterly estimate of small company jobs should be released (but not for the preceding 2 quarters, for which no good data would exist). In this mode of operation, we could have verifiable, comparable data on a large portion of US jobs, and could make fact based decisions on that large portion, and use our own assumptions on anything else we need to.
Excellent explanation of the problems, Menzie. There are even more layers of difficulty than I realized.
You only posted charts of relatively recent data. If you know, has GDP in previous years ever been revised upwards (like Q1 2008 has been)? Or are the only multiple vintages available the ones from recent years?
Sebastian
This is a superb post, which I will link to. Mike Laird’s point is worth expanding on: in data work, one of the most important principles to keep in mind is that the sum of a precisely-known number and a poorly-known number is a poorly-known number. Sometimes we have to make guesstimates for policy purposes (both GDP and CPI on a timely basis fall under this description), but it is useful and honest to publish the more precise stuff separately.
Menzie, please can you post something on what CPI is and isn’t meant to be. The comments suggest some readers are confusing cost-of-living and inflation indices. These are two different things.
Menzie,
Thanks for the post.
It would be nice to know more about that experimental series.
In the end, while the adjustments are arguable for the better, what is also needed is consistency.
If inflation measures today are better than the ones 30 years ago, assuming that changes generally have lowered inflation, doesn’t that mean GDP was understated back then?
So while the economy may be growing today, maybe it grew even faster than the official numbers 30-40 years ago.
Anon says: Menzie, please can you post something on what CPI is and isn’t meant to be. The comments suggest some readers are confusing cost-of-living and inflation indices. These are two different things.
Well, the public expects the CPI to function as a cost-of-living index because that’s precisely how union contracts, Social Security and so on use it. And with so many things levitating ever upward, it just isn’t much use from a cost-of-living point of view that the cost of a few trivialities, such as electronic trinkets, has gone down. Oh, and the use of “core inflation” for any purpose outside of academic papers seems suspect, as from a lay point of view it seems to mean “the rate of increase of the cost of everything, except for all those things that are going up.”
So yeah, it probably needs more elucidation. But I’m not sure that will actually help. Politicians get elected by pretending that things are better even when they are worse. And ignoring the cost of stuff people want but can no longer have because the price has gone out of sight is certainly one way to pretend.
GWG:
Thank you for the spirited defence of the current administration. It certainly appears much less willing to submit to the whims of technobureaucracy. Do you think that reflects the ignorant, superstitutious nature of the constituencies supporting the Bush II administration?
I believe the current thinking outside of the USA is that either an Obama or McCain presidency would be much, much more inclined to rely on expertise, as opposed to superstitution, and partisan special interest goals.
But here’s the bright side: Although the current administration has clearly played with information fed the gullible American public on a number of issues, I’m not aware of any direct tinkering with domestic data gathering agencies.
Thank God for small favours, eh?
Menzie: Great piece. There are far too many folks out there hanging on every gyration of the latest official statistical release.
Menzie-
You’ve really outdone yourself with this last post. A tour de force!
Menzie:
Thanks for putting the issue on the table. For too long a time we have been believing Gov stats instead of our lying eyes.
The problem cannot be solved. Centrally planned states were all critically based on critical statistical data, yet they were unable to generate it. Soviet and Chinese statistics were always garbage.
Instead of lamenting the lack of reliable data, what alternative indicators – numbers that the govenment cannot manipulate – could be used?
Interesting. Like a great many others and for a number of years now, I have felt that CPI no longer reflects real inflation and that we should be puzzled how Western governments get away with it. Perhaps things have been humming along ok until now and everybody is happy and nobody bothered to ask?
Conspiracy theory is nonsense.
Like job performance measures or businesss initiatives almost anyone will find a way to fudge data to show better performance. That is simply a lack of ethics and not a conspiracy.
The IPCC “hockey stick” is another great example of typical unethical behaviour. Policy makers desire a catestrophic issue to agrandize themselves on soap boxes and scientists seek bigger research budgets – it is as simple as that. Scientists who treasure their jobs and seek promotion wittingly or unwittingly appease the policy makers – just like the boss in 99% of business today who nearly always gets the powerpoint data to show his/her initiative is working. If the slide does not tell the right strory then it is sent back to the troops to be “corrected”.
The sad thing is that honest people have become frightened to speak up for fear of being villified. Healthy skepticism about a new wonder drug, a foreign liberation mission, the accuracy in government CPI data, the Global Warming Catastrophe or the wisdom of subprime loans seems to have been lost.
It is as if nobody questions anything anymore….what the computer spews out from the derivatives statistical banking or climate models are just blindly accepted (where is the rationale for $93 trillion notional derivative debt for a private company like JP Morgan?). No matter that LTCM was a wake up call – about computer modelling.
If the majority accept to blindly believe anything they are told then naturally you end up with a situation where snake oil sells all too well!
A good dose of old fashioned skepticism is badly needed everywhere…but please, oh please, don’t pretend it is all a conspiracy. At least take responsibility for the situation, inform yourself and be skeptical.
The next time you walk into Best Buy to buy an HT system and the salesman tries to sell you a pair of $200 speaker cables when ordinary wire would do, remember it is not the salesman or Monster Cables’ fault – it is not the conspiracy that is the root cause – they only do this because your gullability lets them!
Buzzcut: I think management counts a lot. As Lee has pointed out, FEMA has done what is widely acknowledged as a much better job than before — thus highlighting and underscoring the point I was making — management counts (presumably, most of the FEMA staff are the same as those before).
Anon: “Inflation” is the percentage rate of change of the price level, viz., for monthly data, the annualized monthly inflation rate is:
(P[t]/P[t-1])^12 – 1
This calculation can be applied to any price index, including those pertaining to a bundle of consumer goods. The “cost-of-living” index should then pertain to a bundle of goods that a consumer consumes. The CPI fits this. So too does the Personal Consumption Expenditure (PCE) deflator. The former measures the prices the consumers pay, using Laspeyres weighting (with weights now shifting every two years), and the latter uses costs of consumer goods produced, using Chain weighting.
Sebastian: I’m sure the data has been revised upwards at certain times. You can investigate for many vintages by accessing the St. Louis Fed’s ALFRED database.
Peter: BEA is quite straightforward about the fact that there are revisions in the data. All one has to do is go to the actual release (as opposed to reading journalistic accounts), and one will see that the full release notes the mean and standard deviation of the revisions going from advance to preliminary, preliminary to final, and advance to final.
Mike: Yes, if price deflators were overstated in the past, then GDP growth in the past is likely to be understated. On the research series, apologies for omitting the links to the data (see here; unfortunately in PDF rather than Excel format) and documentation; I include it in the post now.
More generally, on the point of incorporating substitution into the price indices there is no entirely good solution. It seems to me BLS’s current approach is a good compromise, allowing for weight changes every two years. Index theory (there is such a thing) makes suggestions about what would be best, under certain conditions. But such suggestions are hard to implement on a real time basis. Chain weighting is an approximation to constructing Fisher Ideal indices.
Charles: I concur that the Administration has clearly stifled various analyses regarding global warming, national security, health and safety regulation, and on and on (see various posts [1], [2], [3]). I am not convinced that they have systematically distorted data associated economic releases; what has been more common is proposals to cease collection of certain data (e.g., pertaining to household poverty), or to cut real funding for data collection.
GNP:
If this blog was called “polibrowser” I would have offered a defense of the current administration, at least in the instances where some beliefs and opinions are conveyed as facts. But since this is presumably a blog about economics, I will pass on the offer.
As far as political interference in data reporting, I have usually been quite impressed by the professionalism of the people I’ve met that work in the various agencies.
What concerns me most is another kind of statistical rigging. When the numbers become a report card on how well the government is performing, it creates a powerful incentive to play policy to the numbers. You cannibalize things that don’t show up in the numbers or only show up after a long lag to feed things that have a short-term payoff.
We’ve seen this in corporate management with the pressure to “make the quarterly numbers.” It happens in schools with teaching to the the test. “Cream skimming” is a time-honored dodge for program managers: focus your resources on items most likely to produce measurable results within the budget cycle. The great irony of the “accountability” slogan is that everything hinges on what “counts” — which is to say what is easiest to count — and what doesn’t.
At some point, the policy chickens will come home to roost. By that time, a little creative accounting or hedonic fudging seems almost benign by comparison — as long as it doesn’t involve any outright lying. It’s the glass half full / half empty paradigm. As long as it’s still half full there is some angle from which you can view it to make it look almost full.
There are lots of wild conspiracy theories that the CPI is understated by 1%, 2% even 3%, but rarely any consideration of what their assumptions mean. Using the establishment CPI numbers real wages for the median worker have been almost flat for the last 10 years. If inflation were understated at they claim real wages would have fallen by 10%, 22% or 34%. Do you think people might have noticed if their standard of living had fallen 10%, 22% or 34% in the last 10 years?
Joseph asks, “Do you think people might have noticed if their standard of living had fallen 10%, 22% or 34% in the last 10 years?”
People do believe their standard of living has fallen. In 1998, right track/wrong track was at 50:40. It is now at 15:75. Consumer confidence is hitting historic lows. In the last three years, personal financial good:bad has gone from 40:40 to 25:55. One would never anticipate these levels of negativism from looking at median wages– or any other economic measure. The official unemployment rate looks great from a historical standpoint.
When the official statistics diverge this much from what people say, one must suspect the statistics. And sure enough, statistics like savings rates, debt burden, and so on are consistent with extraordinarily high levels of distress.
You discussed three possible reasons that the numbers might be inaccurate to some degree, but there are probably others. For example, people in a hierarchy might tend to provide less opposition to things that tilt the numbers in a certain way than they maybe otherwise would. Over time that might end up resulting in significant inaccuracies. That’s not a conspiracy, not incompetance, and not resource constraints.
If you want to be precise you need to use an index appropriate for the purpose for which you are using the index.
For example, if you have a work contract and you are doing the same job this year as last year and you want to ensure that you are able to buy the same things this year that you bought last year, then you can make an index that ensures your pay will adjust from one year to the next to enable those purchases.
If someone retires and you want to ensure that their retirement income enables them to afford to buy the same things for each year of the rest of their life that they bought in the last year of their working life, then you can make an index to do that.
These indexes are different. They are different for each person, and different over time, and neither of them is the CPI. The CPI is meant to indicate price changes experienced by consumers in general, and that’s not a precise definition that allows anyone to say authoritatively exactly what CPI means. There are all sorts of notions of what “consumers in general” could mean.
You could argue that a median consumer would be the best representation of consumers in general, but people are more familiar with the word “average”, and averages represent the value of a dollar relative to all goods and services consumed better, so that’s what gets used. The average is skewed away from the majority of people’s experience by the consumption of a relatively small number of wealthy people, so it’s no wonder that there can be periods during which most people feel the CPI numbers as inaccurate.
If the price of having your lawn mowed and your family paintings dusted doesn’t change, but you mow your own lawn and dust your own paintings, it doesn’t help keep prices as you see them from going up when the price of petrol goes up, but it keeps the CPI down.
There’s all sorts of legitimate definitions of CPI and how to calculate it. The one that’s used by the BLS is as legitimate as any. The one that they used to use in the 1970s was also legitimate. Then there are others that would give quite different results, and they too would be legitimate. Prices of different stuff changes in different ways in different places, and there is no one correct index.
When you talk about GDP, you’ve got to use the GDP deflator, not the CPI. And when you talk about the PCE, you’ve got to use the PCE deflator.
It seems that over the years the CPI has been made to be more like the PCE deflator. If I was in charge of everything I would try to make the CPI as representative of the typical consumer as possible using a median consumer or trimmed mean consumer or something along those lines, and leave the PCE deflator to be the “value of the dollar relative to all consumer goods and services”, because it has a precise definition of being that. I wouldn’t index anything like social security to any of these numbers.
Perhaps we can start with the obvious bias here. Naturally, Menzie, you will want to defend the integrity of the data you use to do your job. It’s silly to pretend that you’ve taken a scientifically objective view of a question in which you have a large vested interest.
That said, let’s get back to the basics that you ignored.
Yes, I have often wondered why this is. Lots of Americans are in serious financial trouble. Media surveys and consumer confidence bear this out. The stock market had its single worse month in June since 1930. My own experience, and that of many people I correspond with as a “peak oil” writer bear that out. Personally, I hardly know anyone is who not living in fear of much higher oil prices and losing their job.
Hedonics is ridiculous, and common sense tells us so. I also note that reductions in quality of cheap goods made in China or elsewhere with a built-in obsolescence does not seem to be part of the calculation. Most people’s experience is that “they don’t make things the way they used to”, meaning the sturdiness and durability are not there, and this observation rings true.
So, if many are suffering and living in fear of the inflation they plainly see at the grocery store for food & fuel–I went food shopping today–then it really doesn’t matter if you choose to believe in the validity of the measurements that tell people inflation is fairly low and GDP is still positive.
I am very glad that ShadowStats exists and I am not alone. Rule changes over the years have only gone in one direction. The history tells us that the numbers have been politically manipulated by both parties, beginning with Nixon in the early 1970’s.
I have quoted you talking about oil prices and the weak dollar, so I like your work. Just not in this case.
Lee wrote: “In other news, 550 metric tons of yellowcake uranium have been moved from Iraq to Canada. (What was Saddam going to do with that?)”
Not much – the UN inspectors knew about it long before the war, and had put it under seal. It was really old leftovers. He would need to build lots of high-tech centrifuges to refine it to anything dangerous.
One note about ShadowGovernmentStats – he’s claiming that the purchasing power of the typical American has fallen 40% since 1990, notwithstanding that the typical American’s spending habits have barely changed (in particular, categories of necessities, such as food, take up no more of the budget now than then).
See here for links and a quantitative analysis, but the key question to consider is this: if we were spending 17% of our income on food in 1990, and we were spending 16% of our income on food in 2006, does that fit better with our purchasing power being down 40% (SGS) or up 10% (CPI)?
I think the answer is no, and the reason goes to substitution effects. As relative prices change, consumers substitute away from the relatively expensive items. Holding fixed the weights overstates inflation. Of course, using the new expenditure shares as weights understates inflation. There is no really correct measure (unless one knows some very specific things about the consumer utility function)
The intellectually dishonest bit here is very clear: unless one knows some very specific things about the consumer utility function and it is shameless.
The CPI is meant to measure changes in nominal prices, not changes in consume welfare as the consumers navigate their utility functions in response precisely to price changes.
The question they answer is how much does it cost *not to change* the position on the utility function, whatever that is.
If inflation were understated at they claim real wages would have fallen by 10%, 22% or 34%. Do you think people might have noticed if their standard of living had fallen 10%, 22% or 34% in the last 10 years?
This is a rather dishonest argument because it equates falls in real wages with falls in standards of living — the two are rather different.
Falls in the real value of a wage can be at least partially compensated by increasing the nominal wage by working longer hours, by having two jobs, by having more than one wage earner in a family; and can be masked at least for a while by getting deeper into debt, for example by remortgaging houses.
Guess what, the bottomost 80% of workers are working ever longer hours and are getting ever more into debt while at the same time trading down all the time in the quality and amount of health care, pensions, education, housing, transport that they can afford.
KevinT: “In “eyeballing” his adjusted real GDP numbers year-on-year for the last 20 years or so, I calculated that he must reach a conclusion along the following lines: real GDP per capita has declined by more than 10%. In essence, we are much worse off now than we were a couple of decades ago. It doesn’t make any sense to me…”
If you look at the BLS and BEA numbers there was a big drop, about 35-40% in the value of a full time job in terms of share of GDP in the late 1970s. The value of work has never recovered, despite improvements in the economy. (No, you can only account for about 1/3 of the change due to the increase in the work force). Basically, workers have been getting less and less of the GDP. Presumably, the money has been going to retirees, the extremely wealthy, welfare queens and other people outside of the work force.
Dave Cohen: I don’t think I have a vested interest. If you read this weblog regularly, you know that I often put in lots of caveats regarding the quality of the data — balance of payments data in particular, but also other macro series.
Further, saying “hedonics” is ridiculous does not help your argument. I agree, we could always do a better job in implementing the accounting for hedonics, but the concept is sound.
Further, saying “hedonics” is ridiculous does not help your argument. I agree, we could always do a better job in implementing the accounting for hedonics, but the concept is sound.
This is based on the rather intellectually shifty hidden assumption that an inflation index should measure the cost of constant welfare or even worse, the cost of a minimal welfare (if one includes substitution effects), not the change in cost of a unchanging lifestyle.
Do lifestyle changes? Perhaps, over decades they do. but to constantly invent *equivalent* (in the sense of welfare) lifestyles as hedonics does is intellectually bankrupt even without arguing that it is being done in a glaringly one sided way.
constantly invent *equivalent* (in the sense of welfare) lifestyles as hedonics does is intellectually bankrupt
Just to be clearer: part of the fundamental and knowing unsoundness of hedonics is that practitioners must literally invent prices of non existent goods. If a car now pollutes less than a car of the same nominal price than 20 years ago, and the latter car is no longer being sold, the astute shysters thst practice hedonics make pluck out of thin air either the price the less polluting car might have had 20 years ago or that the more polluting car might have now if it were still manufactured.
Even more intellectually dishonestly, this implies also estimating what would be the welfare impact of that change in pollution impact between 20 years ago and now.
Defending something as fundamentally unsound as hedonics is ridiculous.
Sandwichman, there’s an easy solution: have the government publish the raw collected data (prices, times, location, product descriptions, hedonics adjustment per product). It wasn’t possible a few years ago but now with high speed internet it costs zero.
A government not tinkering with the data would have zero problem releasing this data. Let competition provide with the best indices and analysis.
As it gives information to consumer it also is a way to fight inflation :).
GWG:
The “polibrowser” blog — I like it!
For policy purposes, how you separate economics and politics is beyond me.
BTW, the strategy of misinformation used by the Bush II administration is similar in flavour to the misinformation strategies used by neo-marxist environmental activists here on the west coast of British Columbia and elsewhere.
The apologists for the status quo in the Canadian welfare state often use the same kinds of tactics and are apparently inspired by the same egalitarian neomarxist attitudes.