Weren’t as strong as some of us thought.
I was surprised; so were market observers. From Bloomberg:
U.S. Economic Growth Slower Than Initially Estimated (Update2)
By Timothy R. Homan
Sept. 26 (Bloomberg) — The U.S. economy expanded more slowly than previously estimated in the second quarter, showing consumer spending was weakening before the credit crisis intensified.
The annual rate of 2.8 percent was down from a preliminary estimate of 3.3 percent issued last month, the Commerce Department said today in Washington. Measures of inflation were higher than previously projected. Personal consumption, trade and business investment contributed less to gross domestic product than the prior estimate, the report showed.
Americans have since cut back on purchases, businesses have put investment plans on hold, builders have scaled back and credit markets have seized up. Economists at JPMorgan Chase & Co. and Morgan Stanley this week cut third-quarter GDP forecasts and Federal Reserve Chairman Ben S. Bernanke warned the economy may falter without a $700 billion bank rescue.
“Consumer spending doesn’t bode well for overall growth over the next few quarters,” said Russell Price, a senior economist at H&R Block Financial Advisors Inc. in Detroit. “It’s pretty clear now that we are in a recession, and it’s a recession that still has some room to run.”
…
I was surprised — not because I think the economy is strong — but because revisions from the preliminary release to the final are on average 0, and have a standard deviation of 0.2 ppts. In other words, they’re not typically too large.
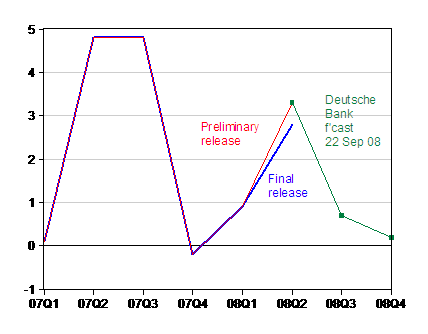
Here’s a picture of the revision.

Figure 1: Real GDP growth, q/q SAAR, Preliminary release (red), and Final (blue). Deutsche Bank forecast of 22 September (green). Source: BEA, GDP releases of 28 August and 26 September, and Deutsche Bank, Global Economic Perspectives, 22 September 2008.
I’ve included Deutsche Bank’s forecast from 22 September; as indicated in the graph, this was a forecast predicated upon the 3.3% growth rate in 08Q2. With the addition of new data (Chicago Fed National Activity Index, durable goods orders), it’s likely that almost all forecasts are being revised downward.
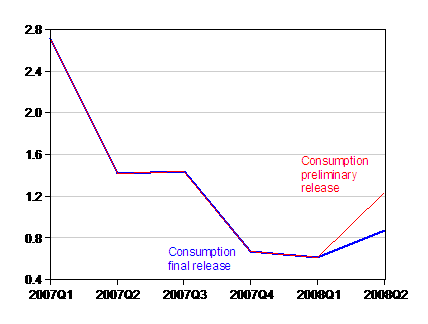
Note that a good 0.37 ppts of the 0.5 ppt revision could be accounted for by consumption (net exports’ contribution, as well as investment’s, were the other notable factors).

Figure 2: Real consumption contribution to GDP growth, q/q SAAR, Preliminary release (red), and Final (blue). Source: BEA, GDP releases of 28 August and 26 September.
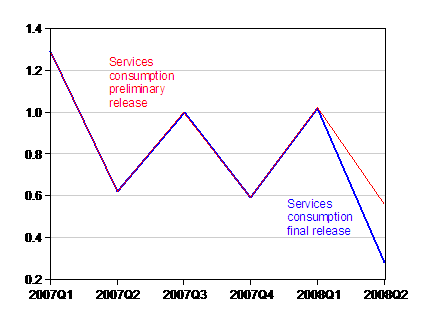
Within the consumption category, it was services that exhibited the largest revision (in terms of contributions to overall GDP).

Figure 3: Real services consumption contribution to GDP growth, q/q SAAR, Preliminary release (red), and Final (blue). Source: BEA, GDP releases of 28 August and 26 September.
By the way, this should all remind people that GDP data get revised. These GDP figures will be revised yet again in the annual benchmark, and will undergo subsequent revisions as more complete data come in.)
In other news, I should not neglect the international dimension. Europe is clearly slowing (PMI’s); Deutsche Bank is forecasting negative growth this quarter, and 0 growth next in Europe. €-coin (jointly developed by Banc d’Italia and CEPR).
In September trend growth in the Euro area has come to a standstill. €-coin dropped further, from 0.17% in August to 0.04% in September, its lowest level since the first publication of this indicator.
For Japan (according to DB), it’s negative growth for the remainder of the year, following the -3.0% growth (SAAR) in 2008Q2. It is hard to see net exports contribution to US growth can be sustained at 2008Q2 rates (approximately about half attributable to exports — the other half is due to import compression).
So, last quarter’s fundamentals weren’t altogether that great, and prospects are hence dimmer than even suggested by this post (from a mere 11 days ago).
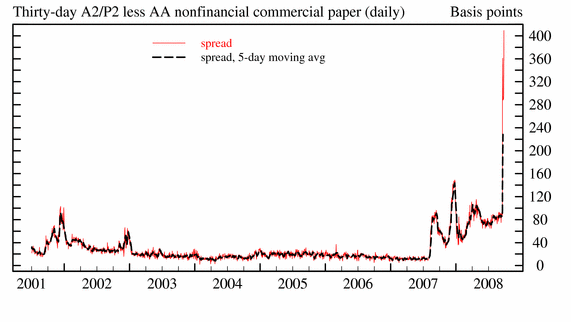
For some variety, today I’m going to show the thirty day A2/P2 — AA nonfinancial corporate paper spread.

Figure 4: Thirty day A2/P2-AA nonfinancial corporate paper spread. Source: Federal Reserve Board, accessed 26 September 2008.
Technorati Tags: recession, durable goods orders,
PMI, consumption,
and GDP.
Ed Hyman use to run a revisions index, keeping track of whether most of the data revision were down or up. That might be an interesting exercise to do these days.
What can be generally be said about the different characteristics of the preliminary and revision data -e.g. is the revision data more weighted to the end of the quarter or to some types of businesses that typically report later?
spencer: That would be a good thing to do. Dean Croushore has some work in the area. In the advance GDP release, there are some summary statistics (mean change from advance to preliminary, advance to final, preliminary to final), which is what I cited in the post.
Josh Stern: See this post for a discussion of how the data used in each release changes.
… from last quarter fundamentals … to next quarter Central Banks possible reaction.
Specifically there’s a lot of talk in the financial markets about likely rate cuts by the ECB and the FED early next quarter.
Is it a reasonable expectation?
It would seem too early to get this conclusion now, because unfortunately the roots of the financial mess these days are inherently related to an excessive global monetary EXPANSION over the last 5 years.