…or: “Yikes!”
There have been plenty of accounts that have noted the growing anxiety over economic growth over the short to medium term. However, this forecast from Deutsche Bank, released last night, is quite sobering, especially when compared to forecasts released just two weeks ago.
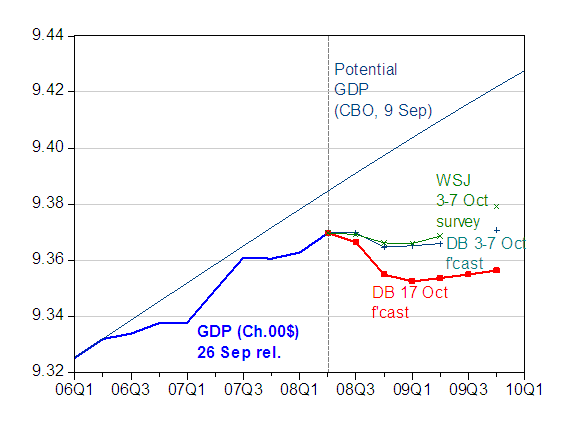
Figure 1: Log GDP, from 26 Sep release (blue line), and implied GDP gaps from WSJ survey (3-7 October survey, green x) Deutsche Bank (3-7 October forecast, teal +), and Deutsche Bank (17 October forecast, red square). Source: BEA, CBO [xls], WSJ [xls], Mayer, Hooper, Slok and Wall, “WO Update: From Financial Crisis to Global Recession,” Global Economic Perspectives (Deutsche Bank, 17 October 2008),
and author’s calculations.
What I find rather remarkable is that over a space of two weeks, we have seen a forecast that was only slightly less optimistic than the mean Wall Street Journal survey forecast (taken over 3-7 October) shift to one much more pessimistic than the most pessimistic one recorded in that particular survey. The sheer rapidity in the deterioration in outlook is also remarkable to me, given that in early October we had been already been a week or so into the credit market freeze.
It is instructive to investigate the implications for the output gap; this forecast implies we will experience an output gap in the area of 7% (in log terms).
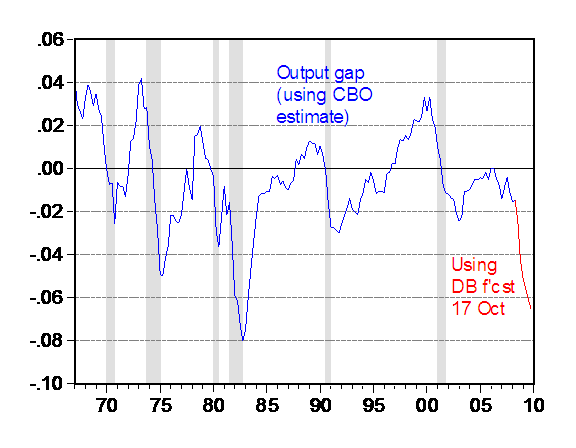
Figure 2: Output gap, calculated as log deviation from potential GDP, from 26 Sep release (blue line), and implied GDP gaps from Deutsche Bank forecast (17 October survey, red line). NBER defined recession dates shaded gray. Source: BEA, CBO [xls], WSJ [xls], Mayer, Hooper, Slok and Wall, “WO Update: From Financial Crisis to Global Recession,” Global Economic Perspectives (Deutsche Bank, 17 October 2008), NBER, and author’s calculations.
Of course, the output gap measure is only as good as one’s guess of potential GDP. For more on the technical aspects of this question, see this post. And forecast output gap is only as good as the forecasts as well. But I suspect if the bean counters count the beans in a similar fashion, changes of this magnitude will not be uncommon amongst the forecasters surveyed by WSJ. I would expect the entire distribution of forecasts (shown in this post) to be shifted downward.
There is some solace in the fact that the predicted output gap is less than the one recorded during 1981-82 recession. And it is substantially less than that recorded during the Great Depression (see the picture in this post, and you can kind of eyeball an output gap in the 30-40% (log terms) range — as long as you don’t believe the Great Depression was a combined leisure and technology shock).
The report summarizes the outlook for the world economy:
Accordingly, we now expect a major recession for
the world economy over the year ahead, with growth in the industrial countries falling to its lowest level since the Great Depression and global growth falling to 1.2%, its lowest level since the severe downturn of the early 1980s. We also see a steep drop in global inflation to 3.1% next year thanks to a collapse of energy prices and rising unemployment.
Returning to the US, one of the interesting aspects of the forecast is that the Current Account balance is expected to improve from -4.7 to -3.5 ppts of GDP, while the fiscal balance is expected to deteriorate from -3.2 to -8 ppts of GDP. If one uses the national savings identity:
CA ≡ (S-I) + (T-G)
Then (dividing through by Y), taking total differentials, and substituting in (-3.5+4.7) for Δ(CA/Y) and (-8+3.2) for Δ(BuS/Y), yields:
Δ(S-I) = 6
where BuS ≡ (T-G). That is some combination of saving increases and investment declines must combine to yield 6 ppts of GDP movement.
As this figure from the 2006 Economic Report of the President indicates, such large shifts in the private saving-investment balance have occurred in the past, as recently as 2000-03. But then it occurred over the span of three years, rather than one…and in that case mostly by a decline in investment.
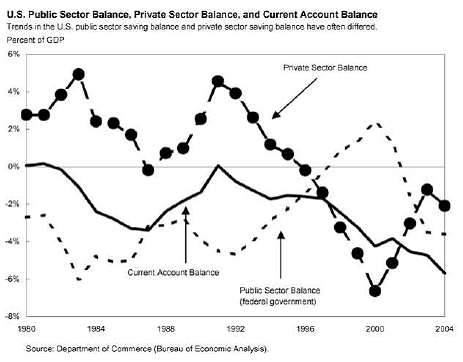
Figure from Box 6-3. Source: CEA, Economic Report of the President, 2006 [pdf].
Substantially increased private saving is consistent with depressed levels of consumption and that in turn is consistent with continued deleveraging in the financial sector, even assuming a satisfactory resolution of the current “credit lock”.
Technorati Tags: recession, potential GDP,
output gap, consumption,
and Great Depression.
Can you leave out the graphs? I can handle the bad news a lot better when you just tell me.
Great work, as usual.
I question this, though I have not yet followed up on your links
“Of course, the output gap measure is only as good as one’s guess of potential GDP. ”
I think the successive estimates get more accurate because these updates reflect a continuing series of transactions which themselves are estimating the old equilibrium view. The point at which estimates become inaccurate is when we are estimating based on new equilibrium points that are developed in the next cycle.
Does potential GDP retain predictability and/or measurability in a highly services-based economy? Is it more difficult to project and extrapolate than it would be for an economy more heavily reliant on manufacturing?
MattYoung and ndk: In principle, potential GDP is modeled in a production function framework, Y* = AF(K,N), where Y* is potential GDP, A is multifactor productivity, K and N are capital and labor. Trends in these components should, with some functional form assumed, such as Cobb-Douglas, lead to estimates of what output would be when all factors of production are fully utilized. I would say that real output becomes harder to measure when services are a large share of output. I’d guess that it’s harder to model potential when services are a larger share, as well, but I have no direct evidence on this. So, you can either (i) just pay attention to the log levels trajectories in Figure 1, ignoring the potential GDP line, or (ii) do your own analysis using some type of trend-fitting procedure (e.g., quadratic in time). Either would be plausible ways to proceed.
Menzie wrote:
There is some solace in the fact that the predicted output gap is less than the one recorded during 1981-82 recession. And it is substantially less than that recorded during the Great Depression…
Menzie,
Good post and an outstanding observation in your statement quoted above that absolutely shouts a question, “THEN WHY DO WE HAVE UNPRECEDENTED GOVERNMENT INTRUSION INTO THE MARKET PLACE?”
The obvious answer is because those in charge wanted to exercise their power even though there was no real justification.
The the follow-up question is, “What has been the result of the intrusion?” The answer is that these same people have driven the stock market down almost 50% and have driven unemployment up.
ndk: “Does potential GDP retain predictability and/or measurability in a highly services-based economy? Is it more difficult to project and extrapolate than it would be for an economy more heavily reliant on manufacturing?”
ndk: When do you think that the economy became service-based rather than heavily reliant on manufacturing? If, for example, we look at sectoral employment data, the BLS series starts in 1939. At this time, over 60% of non-farm employment was already in services. (National accounts data would give a slightly lower share to services, but don’t go back as far.) My point is that the economy has been dominated by services ever since we started to collect data.
“There is some solace in the fact that the predicted output gap is less than the one recorded during 1981-82 recession.”
Be careful. The estimated output gap during the 1981-82 recession uses much more information than our current predicted output gap. As we obtain more information, we can better estimate the output gap, so our estimates will vary farther from zero (their unconditional mean.)
My point is that if we were rerunning the 81-82 recession, our output gap *predictions* would be much smaller than the estimates we would make several years after the fact.
SvN: Both excellent points.
Regarding services, what is true is that services have been gaining an ever larger share of output, and some of these services that have gained in the past twenty years are particularly difficult to measure in terms of real output (haircut output is hard to measure, adjusting for quality, financial services output is even harder, except for some things like check processing).
Regarding the output gap in real time, I certainly defer to you on this question. That’s why I hedged by saying “some” solace. Anybody who has looked at different vintages of output gap estimates (from OECD, or CBO, or anybody else) knows that one has to take these output gap figures with a grain of salt. That’s why both Figure 1 is provided as well as Figure 2. Skeptics of estimates of potential GDP can insert their own preferred measure (just remember, it — like these estimated series — is also an estimate).
Even with all this bad news..Cant the stock market rally with all the liquidity that was injected? What do you think?
Andy
http://www.myinvestorsplace.com
Andy: Yes. One dead-bear bounce rally coming up.
Why? Equity values (from some perspectives) may have overshot to the downside for the moment. Information from the real economic impacts of this financial crisis will tend to trickle in and investors will remain confused.
Perhaps it goes without saying but there will be above average volatility.
I expect folks to experience extreme difficulty trying to formulate ‘useful’ inflation expectations going forward. On the one hand, a whole bunch of traditional wisdom suggests that inflation is about to radically increase. On the other hand, the contraction in input markets will immediately lower measured inflation.
Graph 1 baffles me.It puts present GDP at $2,4Billion, not $14 trillion.
George Schlenker: You’re taking the log. You need to take the anti-log.