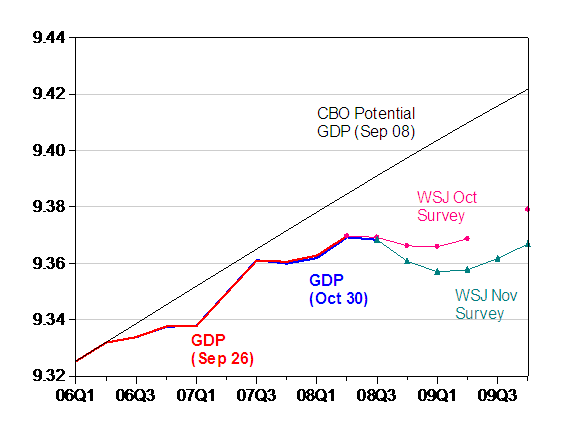
One of the points that all the panelists at last Thursday’s event sponsored by WAGE (“The Global Economic Crisis”) agreed on was how quickly the macroeconomic situation has deteriorated. I wanted to see if one could quantify the rapidity with which growth prospects have changed. Here is one perspective, showing the mean forecast from the October and November WSJ surveys of forecasters.

Figure 1: Log real GDP, from 26 Sep 08 final release (red), and from 30 Oct 08 advance release (blue), potential GDP (black), WSJ mean forecast from October survey (pink circle), from November survey (teal triangle). Source: BEA NIPA releases [link], CBO estimates of 9 Sep 08 [xls], WSJ survey of forecasters from October and November [link].
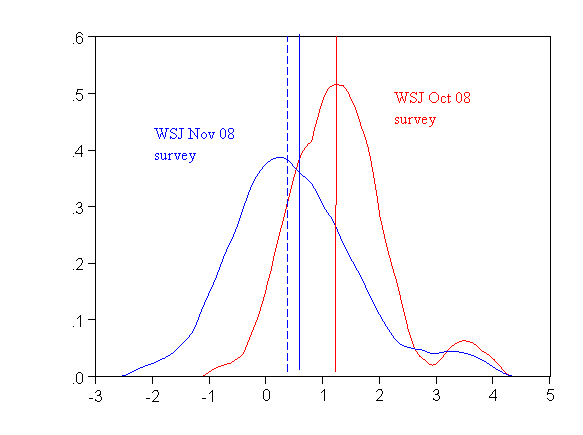
The drop in the economy’s forecast trajectory is startling; the November forecast is below the most pessimistic October forecast. Hence, it’s no wonder that the urgency associated with a stimulus plan has increased. However, as is often stressed in introductory stats courses (I’ve got my teaching hat on now), the distribution can be almost as informative as measures of central tendency. In Figure 2, I show the distribution of forecasts for 2009 q4/q4 growth.

Figure 2: Kernel histograms for forecasts for 2009 q4/q4 from October survey (red) and November survey (blue), using . Vertical axis is density, horizontal axis growth rate in percentage points. Solid vertical lines are means, dashed line is median. Source: WSJ survey of forecasters for October and November [link], and author’s calculations.
In early October, there was substantial consensus on what growth would be in 2009. Not only was the distribution fairy symmetric (mean=median=1.3 ppts), it was also fairly tight (std dev = 0.8 ppts). In early November, not only had the distribution spread (std dev = 1.1), it became less symmetric, with the median below the mean (0.40 ppts vs. 0.53 ppts).
Two implications flow from this: (1) the mean forecasts incorporate some very high forecasts (Mark Nielson, of MacroEcon Global Advisors; Joseph Carson of AllianceBernstein; and James F. Smith of Western Carolina University and Parsec Financial Management; at 3.1, 3.3 and 3.4 ppts, respectively, all over one standard deviation above the next highest forecast); (2) hence, the better representation of what forecasters expect is the median forecast, and this implies even slower growth than implied by inspecting averages.
There is one additional aspect of the survey that is interesting; mean and median forecasts imply similar levels of GDP for end-2009 (with an output gap of about 4% in log terms). That is, those projecting faster growth in 2009 also forecast a deeper decline in 08Q4. Hence, there is considerable evidence that forecasters believe in reversion to potential output (although the most pessimistic forecast projects a 7.1 ppts of GDP output gap in 09Q3).
Useful insight into economists’ thinking. Yet I can not understand why these economists (on average) foresee an upturn a year from now. The most positive thing I can think of its that they believe a robust Obama administration policy will stimulate the turnaround. But how do they believe the following problems will be addressed:
1. Home real estate price declines and for sale housing inventory returning to 5-6 month norms from its current 10 month backlog.
2. Bank leverage near 30:1 with massive bad assets coming down to historical norms of 10-12:1.
3. Unemployment, now above 6% and projected to go to 8% or more, returning to a more normal 3-5% range.
4. Capital investment by major (and minor) firms to spur economic growth in the face of bank unwillingness to lend, even at still-high rates as they confront not just illiquidity, but insolvency.
I could go on, but the point is that economists (as a group) have consistently underestimated the severity–depth and speed–of the current downturn for a year. I have little faith that their estimates beyond the next quarter will be anywhere near reality. I would certainly take “the under” in a wager about US GDP a year from now against this average (and maybe even the one standard deviation “spread.”)
The what of the rapid decline is not as important as the why. There can be little doubt that it was the massive government intervention predented by Sec. Paulsen and passed over the objection of the American people after the House turned it down. Then by subterfuge the Senate did an end run around the Constitution by amending a bill that had nothing to do with the bailout bill, passing it an then sending it to the House, a dose of poison all sweetened until it was sickening. Look at the timing of the market decline. It is absolutely obvious. Our current crisis was totally caused by the coordinated action of our government.
And now I read that the bailout has risen to $7.4 Trillion half of everything produced last year. Give me a break! Can’t even the most avowed Keynesian see this disaster?
could go on, but the point is that economists (as a group) have consistently underestimated the severity–depth and speed–of the current downturn for a year.
When the capital markets first locked up (August of ’07), everybody was talking about recover in Q3 or Q4 of ’08. Why did they pick those quarters? Because it was a year away, and it makes sense that we would have a recovery in a year, at most. It was people going with a gut feel, nothing more.
Now we’re talking about recovery in ’10. Again, it’s a gut feel. That’s a long time from now, relatively. We have to have a recovery by then, right? Right?
Things may not be as bleak as some believe. I hear that the big American SUV plants are on overtime again…
Could a Tahoe be our savior?
This is a good analysis of how expert opinion shifts (slowly) as events and facts change. The November survey has a few folks who are still saying “what crisis?” and some others (early adopters, or bends with the wind – depending on your view) who have shifted their forecast significantly. This happens in all walks of life, but it is more public with economists because of their organized forecasting. For example, the same thing is going on with people’s views about the auto industry. The same thing happened over a period of 2 years in people’s views about Obama’s candidacy.
This is an excellent experiment to watch because the change is so large and sudden, and the data will continue to be public. You may be able to get some “adjustment co-efficients” that describe certain types of economic behavior.