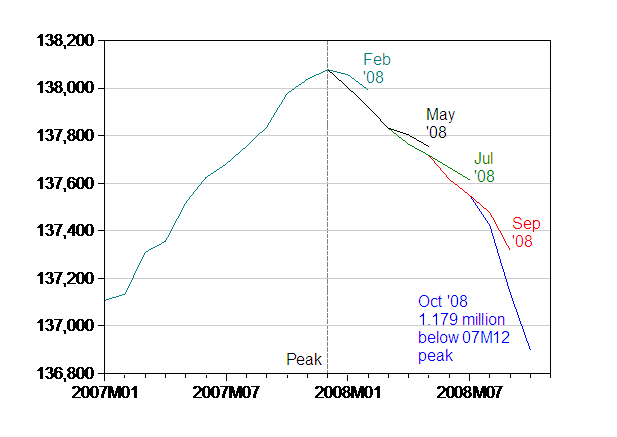
The latest employment release was stunning, insofar as the NFP employment figure was far below consensus [0]. Net job loss was 240K, rather than 200K; moreover, September job loss was revised upward by 125K. In addition to Jim’s assessment, some reaction is summarized here. The acceleration in net job loss is depicted in Figure 1.

Figure 1: Nonfarm payroll employment, seasonally adjusted, various releases. Source: BLS, employment situation, various releases.
Note that Figure 1 highlights, by virtue of plotting the previous vintages of employment releases, the constant downward revision of payroll employment figures. While Dash of Insight’s Jeff Miller has pointed that these revisions are small relative to the benchmark revisions will come our way, the latest revisions do seem to be getting bigger.
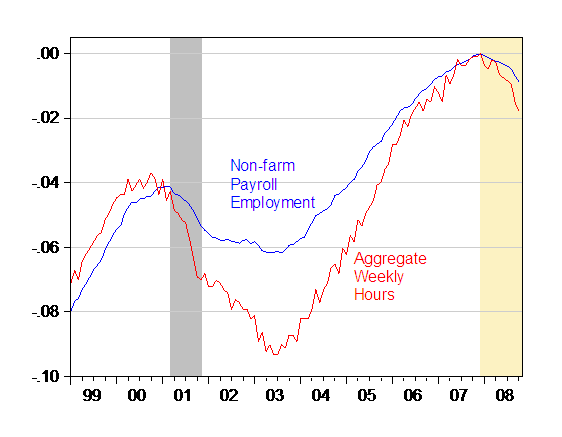
Justin Fox has correctly pointed out that quantitatively, net job loss in September and October is quite small, at 0.4%. Even with expected revisions, this percentage for September-October will not change substantially. Most Americans will remain employed throughout this downturn, and adjustment will occur at the margins. One of those margins is the extent to which employed Americans are working. Figure 2 depicts aggregate hours against nonfarm payroll employment, both normalized to peak values in 2007M12.

Figure 2: Log Nonfarm payroll employment, seasonally adjusted (blue) and log aggregate weekly hours index, seasonally adjusted (red), normalized to 2007M12 peak. NBER defined recession dates shaded gray. Tan shading denotes period after 07M12. Source: BLS, employment situation, November 7, 2008.
While employment has fallen 0.9% (in log terms) from peak at 07M12, aggregate hours worked have fallen 1.8%.
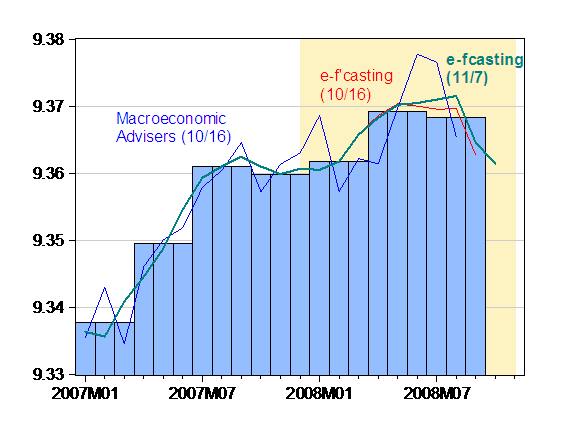
In terms of output, we’ve certainly had plenty of bad news. Here is the most recent take from e-forecasting.

Figure 3: Estimated log GDP from e-forecasting (blue), and from Macroeconomic Advisers (Ch.2000$). Tan shading denotes period after 07M12. Source: e-forecasting 10/16 and 11/7 releases and Macroeconomic Advisers [xls] 10/16 release.
According to e-forecasting, October GDP is declining 3.7% m/m at an annual rate (in log terms).
Here’s Bloomberg’s assessment.
Technorati Tags: recession, nonfarm payroll employment,
revisions, and GDP.
Excellent graphics Menzie …the picture is so frightening, if it weren’t for the margin comments
(Most Americans will remain employed throughout this downturn, and adjustment will occur at the margins.)
I would have split for the big box stores to load up on canned goods.
In fact, I’m not even over-weight when I ponder my girth…just a little thick at the margins.
But this bit was somewhat less consoling:
One of those margins is the extent to which employed Americans are working
thinking about the easy (fabulous) [outrageous] money made in the housing sector and the job ( psychological, social] dislocations/disruptions that are coming…
ok, canned goods and ammo.
Paraphrasing Justine Fox Menzie wrote:
Most Americans will remain employed throughout this downturn, and adjustment will occur at the margins.
Menzie,
Excellent post. Thanks for making the unemployment increase easier to understand with your graphics.
It should be noted concerning the quote above that most Americans were employed during the Great Depression also.
Unemployment will reach high double digits, and that’s using govs under-stated figures, within the next six months
I mean high teens, of course. Not 99%.
The problems are becoming runaway in nature. Business always looked to consumers to start the spending out of recession phenomenon. Consumers simply can’t do that now. Savings are depleted, home values are shot, taxes continue to go up at the local level and most likely at the national level, and there is a dirth of credit.
This will be a Japanese-style correction.
Someone needs to clean house with the methods used to report labor force numbers. A downward revision of 125,000 jobs after one month when state unemployment payment data showed month by month growth – tells me that they are not using the available data well. Then there’s the birth/death model which is 76,000 jobs in the latest report, when anecdotal information says small businesses are the worst hit. It means job losses were more like 240,000 + 76,000=316,000 in September. Watch this for next month’s revision.
Why do we look at employment data on a unit basis, rather than on a percentage basis as is done for almost all other economic indicators?
There are substantially more people employed now than in previous recessions and on a percentage basis the current recession is not yet nearly as bad as any of them.
“Most Americans will remain employed throughout this downturn, and adjustment will occur at the margins.”
Technically, 49% unemployment also ‘means that most Americans are still employed.’
forecastpro: Figure 2 is plotted in log terms (relative to 2007M12). Jim Hamilton’s post plots changes in percentage terms.
Triple III hedge fund manager Warren Mosler wrote:
“If government had declared a payroll tax holiday (treasury makes the FICA payments for employees and for the business) three months ago car sales would be up and mortgage delinquencies down.”
A friend of mine wrote:
… I think the TARP should be renamed Bank Asset Relief Facility or (BARF).[/quote]
I am not a big Mosler fan but he is right on here. Imagine – the $2 trillion bailout is a little over $6,000 per person in the US: man, woman and child. So if all the bailout money had been given to the people every family of four could have purchased a brand new $24,000 car.
You tell me. Is bailing out investment bankers a better stimulus than giving the money to consumers? Even a Keynesian and see this. Had the bailout been in the form of a tax cut the “stimulus” would have been fantastic.