Michael Dueker is a senior portfolio strategist at Russell Investments and formerly was an assistant vice president in the Research Department at the Federal Reserve Bank of St. Louis. Michael is also a member of the Blue Chip forecasting panel.
In early February 2008, Michael submitted a piece to Econbrowser that correctly predicted the onset of the current recession, using a model-based forecast.
We are pleased that that he is now presenting forecasts from the same Qual VAR model concerning the recession’s trough date and the magnitude of a jobless recovery to follow, subject to the disclaimer that the content is the responsibility of the author and does not represent official positions of Russell Investments
and does not constitute investment advice.
Current business cycle forecasts see a July or August 2009 trough and a jobless recovery until March 2010
In analyzing the current recession, it is useful to be able to predict the trough date and its depth and to compare it with previous recessions. To do so, I use the Qual VAR model (or this link) because it is designed to identify and characterize recessions in real time, based on the incoming macroeconomic data, as well as forecast future business cycle developments.
The announcement from the National Bureau of Economic Research on December 1, 2008, of a cyclical peak in December 2007 meant that the recession onset date I forecast earlier was realized, despite the fact that the
current recession did not begin with at least two consecutive quarters of negative GDP growth (at least not in the GDP data available to date).
In general, the Qual VAR model espouses Jim Hamilton’s view, that recessions correspond to a switching of gears in the economy, rather than simply a loss of speed due to a few randomly missed strokes within a single gear. As Hamilton has noted, if economic cycles do not signify more than the loss of speed, then the amount of speed the economy needs to lose to signify an economic downturn becomes completely arbitrary, as does the meaning of an economic downturn. In other words, the Qual VAR treats recessions as distinct events in the economy, akin to switches between high and low gears. Inferences as to whether the economy is in an expansionary or recessionary state add important perspective to interpretations of GDP numbers, such as the 2.8 percent GDP growth rate in 2008Q2.
One attribute of the Qual VAR approach is that, during periods when the NBER classification is well-established, one can use those classifications to determine the sign of the business cycle index. Until the NBER’s announcement on December 1 of a peak, however, the NBER classification of 2008 was not yet certain. Throughout 2008, I was able to run the model without imposing either a positive or negative sign on the index’s 2008 values. During this period, I could use the model to infer the probability that a given month pertained to a recession. Throughout 2008, the model’s estimates suggested that a recession was underway, although the data for July and August 2008 indicated that the probability of recession had fallen to about 50 percent prior to the failure of Lehman Brothers. After that, the business cycle index began a sharp decline throughout autumn 2008.
The release on December 5 of the November 2008 payroll employment data
made the projected path of the recession go deeper than it went in previous iterations of the Qual VAR forecasts.
One handy feature of the Qual VAR is that it provides separate forecasts of the end of the formal recession and the date at which employment growth is expected to become positive. Thus the model can project the extent to which we can expect a jobless recovery to follow the formal recession. For example, after the 2001 recession ended in November 2001, negative employment growth continued unabated until October 2002 and payroll employment did not reach its cyclical bottom until August 2003.
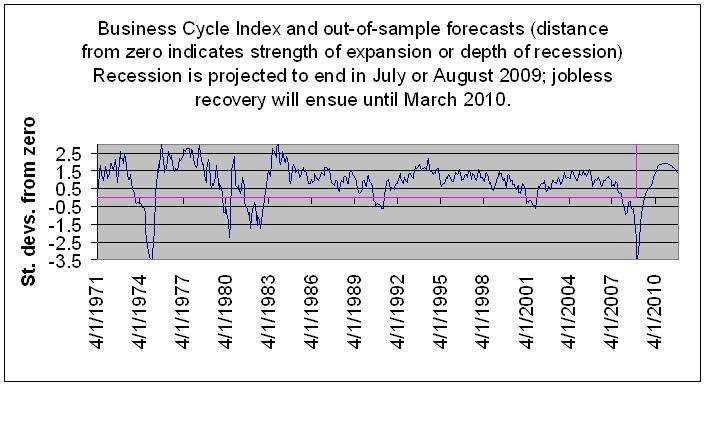
The figure below shows the model-implied business cycle index, where its distance from zero indicates either the depth of a recession
or the strength of an expansion. The history of the business cycle index illustrates the so-called Great Moderation in the U.S. economy after 1984. Until the current recession, the business cycle index stayed within a comparatively narrow range between -0.5 and 1.5 after 1984.
The projected depth of the current recession poses a strong counterargument to the Great Moderation hypothesis.
|
Nevertheless, one could argue that the U.S. economy was experiencing a run-of-the-mill recession until the failure of Lehman Brothers, with the business cycle index bouncing around -0.5.
After that shock, financial market conditions sent the economy sharply downward.
As for a snap-back after the end of the formal recession, the projected path of the business cycle index is not as vertical as one might hope between zero and one in the second half of 2010.
In fact, the cumulative area below +0.5 in the current downturn between August 2007 and January 2011 is quite large. Again this event calls into question the permanence of the Great Moderation in the U.S. economy after 1984.
Given that the past two recessions have been followed by jobless recoveries, where employment continues to fall and remain sluggish well after the end of the formal NBER recession, it is interesting to look at the Qual VAR’s forecasts of employment growth. The second figure shows that the forecast is for a jobless recovery to follow the NBER recession again, with payroll employment declining until March 2010 and not returning to trend growth until July 2010.

|
The most similar recession to the current one is 1973-75 when the unemployment rate increased about 4-1/2 percentage points in about a year and a half. In the double-dip recession in the early 1980s, the unemployment rate increased by 5 percentage points but this increase took 3-1/2 years. The stock market decline this year also resembles the death by a thousand cuts in 1974, when the U.S. stock market declined by about 30 percent without hitting a particular crash point.
A few details about the model:
Here I have focused on a monthly version of the business cycle model that uses nonfarm payroll employment as the measure of economic activity. In addition, the model uses data on core CPI inflation, the spread between the
interest rate on one-month commercial paper rate and Treasury bills, the rate spread between corporate and Treasury bonds and the slope of the yield curve. These quality spreads among interest rates are particularly important in the current context where the failure of the investment bank Lehman Brothers led to a severe contraction of lending in financial markets. For example, issuance of three-month commercial paper essentially ceased.
On April 4, 2007 I started my website with the forecast “…a recession is a high probability rather than a mere possibility.” At the time I forecast a recession lasting a minimum of 20 months.
On December 13, 2007 I wrote:
“While the economists debate whether or not we will tumble into a recession and Alan Greenspan climbs way out on the limb of prediction and says the odds of a recession are clearly rising, we say the time for debate is over: The recession is upon us and it will last 21 to 25 months providing the situation continues to improve as it did in November. Further deterioration could indicate a recession lasting more than 25 months. We always knew the piper would have to be paid for our journey into extravagant excess. The bill is now due.”
You can see the details of the results of my 35 years of research and other forecasts on my website: http://jpetervanschaik.googlepages.com
Interesting indeed. Until some better idea comes along, I am going to adopt this view as a good reading of the entrails.
However, I think the length of the decline has not yet been determined. Unknown future action of the Federal government will influence the length of the decline. If the current policy of trying to prevent AIG and Citigroup from failing continues and is extended to any other major financial firm, I expect the decline to continue for years and not follow this optimistic forecast.
Fear and uncertainty controlled financial firms decisions after Lehman collapsed. Those two emotions were rational, so long as the size and distribution of “toxic assets” among financial firms were unknown and so long as the extent and depth of the decline is unknown.
I think those realities have not been destroyed or overcome. It will become clear, as time passes, that the tactic of throwing money at the problem, used by Paulson, has not erased legitimate fear and uncertainty.
I expect the current decline to continue until the problem of unknown size and distribution of toxic assets is overcome and foreclosures cease growing.
Perhaps the system is adjusting on its own as firms buy other firms, using Paulson’s money. Perhaps foreclosures are no longer increasing. We will all know the length of the current decline, after the fact.
I’m not an economist, but I did stay at a Holiday Inn last night.
🙂
I’m not so sure I buy pre-existing models for what’s happening. To borrow a line from Mr. Spock, this is like nothing we’ve dealt with before.
Every country in the world right now is revving up the printing presses and trying to pour dollars into their economies to get them going again. Over at the UK Housing Bubble blog, there are daily stories about the government urging lenders to lend and borrowers to borrow. Meanwhile there is massive debt at every level of the economy.
Add to that the demographic decline across the West and Japan and you’ve got something not represented in previous data.
Models are only as good as the data that created them. I don’t see how these models can take into account all of the things that are going on.
Instead, I’m taking the Paul Volker view of the world. Consumption is going to contract, massively and globally until it’s in line with production. Do these models reflect national governments everywhere doing everything they can to stop the inevitable? I don’t think so.
Interesting but infortunate. I wonder, nevertheless, if we have already seen the maximum speed of contraction, and if a worse contraction would change the prediction.
I hope it doesn’t get any worse than this grim prediction.
Professor,
may I ask you to reconfirm :
Do you think that it is possible to predict the (economical) future, using statistical science ?
Do you think that it is possible to predict the (economical) future to a certain extent, using statistical science ?
“Instead, I’m taking the Paul Volker view of the world. Consumption is going to contract, massively and globally until it’s in line with production”.
Supply and demand will come into balance. But we have overcapacity in auto manufacturing. A more likely adjustment is that production will contract to come in line with demand.
Whatever – a smaller global economy will happen before growth resumes.
“The release on December 5 of the November 2008 payroll employment data made the projected path of the recession go deeper than it went in previous iterations of the Qual VAR forecasts.”
Deeper, but not longer? What if we get another bad NFP number in January, how will that effect the model?
Thanks!
Thanks ReformerRay for stating the obvious… There can not be any significant economic recovery until the financial markets realize their losses, and foreclosures significantly decline.
At the risk of repeating myself too often, I’ll say it again – The residential R/E mortgage losses will not abate until late 2011, when adjustable rate mortgage resets are completed. The scope of these financial losses will be discovered AFTER sufficient time has elapsed to observe the rate of mortgage default, the final disposal value of forclosed property, and the dominoes to fall in the bond and derivative markets… 2012, 2013?
Adding to household debt, we can add defaults on commercial R/E, LBO and privatization loans, and commercial lines of credit… We are talking about a system-wide banking collapse caused be excessive asset valuation, and securitization of virtually all real assets.
Bayesian chained regression considering only GDP, CPI, FFR, Term Spread, and “Romer dates” may be sufficient to map short-term business cycle variations. They are not sufficient to map long-term banking collapse and liquidity destruction. Unlike other post-WWII periods, the current situation reflects deflation occurring DESPITE heroic efforts by the FED and the Treasury to re-inflate the economy.
Just like the “Value-at-Risk” mis-modeling that have resulted in the current Derivative and Securitization crisis, I fear that sanguine reliance on the Qual VAR model to predict economic behavior in current circumstances may be fatally flawed. At any rate, its difficult for me to make a final judgement… Michael Druker’s 2001 paper did not discuss the date range of the data used to seed his model and determine probabilities, nor did it discuss how inferences about employment response or employment data would be factored in the Qual VAR model. Similarly, that paper did not describe how the duration of a recession could be predicted. Obviously, the Qual VAR model has been enhanced considerably since 2001. However, I am not inclined to spend $25 to find out how the model has been modified, nor do I live close to a university research library so that I can read Mike’s more recent 1985 8-page JBES article.
Mr. Dueker, what are the independent variables in your formula?
Unless you are including household debt/GDP, now at an unprecedented level (and going higher as GDP falls faster than household debt, now), my hunch is that you will find your model has insufficient explanatory power through ’12 (which is when I project GDP will trough).
Looking at your ’03 paper, are your four variables here again inflation, GDP growth, term premium, and Fed funds rate?
This time, things REALLY ARE DIFFERENT than past recent recessions, with asset prices falling strongly, a huge risk premium, etc.
Today’s macroeconomic variables — worse than the credit excesses that peaked in ’29 — sure makes this look like a setup to a Greater Depression.
From MarkS – “The residential R/E mortgage losses will not abate until late 2011, when adjustable rate mortgage resets are completed”.
No way to speed up this process? No conceivable law that could be passed to intervene constructively? I expect the receptivity will increase to almost any proposal, if current conditions drag on for another 6 months.
The following proposal deals with only a part of the problem but it at least breaks the barrier that we must not do anything to breach the contract with the investor.
Answer: Pass a law dealing with housing which mandates mortgage modification for those home owners who have the means to pay a mortgage, for the next 3 years, if the mortgage were fixed at 70% of the amount they are currently paying, for those mortgages that investors ask the U.S. courts to foreclose on. This requires a local credit counseling agency to investigate the financial status of the home owner, to see if they could pay monthly if the level of the mortgage is reduced. This agency will also use its access to the books of the home owner to eliminate from this program all household who have the resources to pay the mortgage at the current level. Mandate that this action by the court will cease 3 years after the request for foreclosure current laws will then apply.
ReformerRay writes, “Unknown future action of the Federal government will influence the length of the decline.”
Listening to the press leads me to believe that our incoming team is a bunch of Keynesians. Obama seems to believe that a government dollar spent is just as good as a consumer dollar and we can spend our way out of this. Krugman won the Nobel prize. This leads me to think things are going to get much worse before they get better.
The automakers have been relieved of the necessity to downsize or revamp labor agreements at least in the short run.
Jim Hamilton and many who post here have great insights into the economy, how we got here, what needs to happen before things get better, etc.
I am more pessimistic then the model simply because everyone in government is climbing on top of one another in an attempt to stop a recession without ever once asking whether they should.
Reminds me of the Ronald Reagan quote, “The nine most terrifying words in the English language are, ‘I’m from the government and I’m here to help.'”
To listen to the press or our government officials, one would think a recession was more dangerous than 20 young muslim men in flight school or something, and it must be avoided at ANY cost.
Wow, 4.2M more jobs lost by June. That would put the 2009 bottom below the early 2001 peak. So net negative job growth over almost 9 years.
The real answer is simple. Yet people are too xenophobic to support it :
Increase immigration from SKILLED immigrants. Allow 1 million doctors, engineers, scientists, nurses, accountants, etc. to legally immigrate.
Despite the poor job market, these people will get by, get jobs, and increase consumer spending. They will mop up some of the excess housing inventory. They will offset some of the workforce shrinkage. They will offset our shortage of engineers, that we keep hearing about.
The unemployment rate for college-educated people is just 3%. These immigrants will not glut out the job candidate market.
Again, these are SKILLED, LEGAL immigrants. That is not the same as unskilled, illegal immigrants. Too many people fail to recognize this huge difference.
It seems this model is showing a grand total of 7M jobs lost from the peak to the trough. Since only 1.8M have been lost so far, another 70% remains to go.
Wow, this corresponds with an UE rate reaching 11%. Even Nouriel Roubini is only predicting 9%.
I’m not sure it will go as high as 11%.
As for data, the current vintage of the model uses model nonfarm payroll employment as the measure of economic activity. In addition, the model uses data on core CPI inflation, the spread between the interest rate on one-month commercial paper rate and Treasury bills, the rate spread between corporate and Treasury bonds and the slope of the yield curve.
By substituting data series, I can reduce the extent of projected job losses, but the projected length of the recession also becomes unrealistically short in my view.
No model will forecast multiple series jointly in exactly the way that matches one’s prior beliefs, but models, with all of their warts, can help guide our thinking about possible economic scenarios.
Thank you, M-D-.
I agree with the duration of recession and jobless recovery phase. But I think the magnitude of job losses is just too high. A UE rate of 11% is implied here.
http://blogs.wsj.com/economics/2008/12/05/broader-unemployment-rate-hits-125/
The Broader Unemployment rate is at 12.5%. I have been told that this rate is closer to the measurement of unemployment during the Great Depression but I would need confirmation.
Dueker’s numbers on unemployment simply reinforce my call of double digit unemployment by 4th QTR 2009. Dueker is not taking into account what government will do to create more unemployment so I guess that is my hedge number.
MDueker: “By substituting data series, I can reduce the extent of projected job losses, but the projected length of the recession also becomes unrealistically short in my view.”
But in your previous post here: “A large percentage of these assessments, while useful, are judgmental in nature and ought to be compared with formal, model-based recession forecasts.”
Now Im confused. Do you vary the data until the result matches your subjective judgment, perhaps in order to “re-infer” what variables drive your beliefs (given the model)? Or do you use formal Bayesian inference to adjust your beliefs algorithmically?
Oh and btw, aptly named model… in German, “Qual” means horrid pain. Indeed!
Out of curiosity, any information on how this model would have performed during 1937-1938? Do we also have information on how this model performed with regards to nonfarm payroll employment change forecast during the 2001-2003 period?
Are you really predicting another 5,000,000 job losses!?!? Wow, this is really going to hurt. I’d really like to know that I’m reading that chart correctly.
Bill
If you want to know what will happen, do the following:
1. Recreate Bernanke / Gertler / Gilchrist’s Economic Accellerator model. I am not intimately familiar with the model, but your model MUST include a Future’s market (minimum equity, currency, interest rate & commodity).
2. Create a class of investment vehicles that require increases in collatoral based on deviations from historical GROWTH – not norms. In addition, this class requires assets in the BGG model to pay principle and interest.
3. Create another class of investment vehicles tied to BGG model as well as the second class of investment vehicles. This class should be valued at deviations from a moving average correlation matrix in the BGG model.
4. Finally, create a class of highly leverage investors that invest in the BGG markets, Class 1, and Class 2. Their investment rules should be random permutations of the moving average correlation matrix.
Start at 1987 and let her rip.
When you start seeing what is in store for us, call Bernanke and Paulson and tell them they must shut down all the auxiliary markets – including futures. Then declare a bank holiday and work out an unwind.
This event is not a Black Swan. It is not a repeat of 1929. It is a financially engineered capital destruction machine that has been highly leveraged.
The synthetic markets have coupled with the real markets and there is not enough capital in the world to buffer the global economic system from its effects.
Work fast – we can’t print oil or food.
ReformerRay – Kudos to you for the creativity… Allowing a 3-year, 30% discounted holiday on mortgage payments for distressed homeowners might buy some people some time, but it doesn’t avoid the inevitable… The homeowners bought a house for more than they could afford, probably at an excessive price. If the participation rate is high on your scheme, the three year delay might increase the duration of uncertainty in the credit markets, slowing the recovery.
My suggestion is that we pass a law that removes all record of mortgage payment lapse or mortgage default from homeowner’s credit history if fraud or other illegal behavior is not involved during the period 2007 through 2015. If credit is not effected, foreclosed homeowners can buy back into the home market at a lower basis, (but with some required initial down-payment… do I hear 20% ?). This will speed-up the recovery process, and end-up with the dominoes in about the same final positions that they would occupy if nothing were done at all.
Michael Dueker – Thanks for the kind elaboration on your current model’s independent variables, and how the data series selected can affect the model’s projections.
I would like to interject that from my viewpoint as an engineer, modeling’s value derives from its ability to REDUCE subjective bias in analyzing a problem.
I am curious if the NFP data is scaled in anyway relative to the size of the workforce? I realize we are talking about changes in the number of jobs, but is loosing five million jobs in 2008 equivalent to loosing the same number in 1974 for instance?
Anonymous – Your description of the constraints for a model describing the derivative markets was so hilarious that I wet my pants…
Marks –
All empirical models suffer from the bias that previous history can explain future events.
However, we currently have multiple unprecedented events:
– extreme commodity, stock, & bond volatility
– backwardation in Gold at the same time as contango in Oil….
– negative yields on treasuries
– debt / GDP that is rising exponentially as Debt increases faster than it is written off and GDP contracts.
– bank failures (in terms of assets) that are parallel to 1930, but we are only one year into the “recession”
– finally, the subject of this article, a labor market that is contracting globally at an alarming pace.
I find it very difficult to believe that an empirically derived model can find historically relevant data to accurately predict future events in this environment.
I believe that either a system dynamics or an autonomous agent approach is the only way to arrive at a probable endstate given the degree of connectivity between the real and synthetic economies (those notional markets currently valued at several hundred trillion dollars). AIG went bankrupt because of bad bets in the CDS market ($55Tr). In 1974 was there even a market with a notional value 5 times as great as the GDP?
The macro data is moving far to slow. Oil has gone from 147 to 40 and futures price January delivery at 55.
Perhaps I am bias, but I believe it is with good cause.
Real goods are being priced by computer models that are basing trades on recent correlations between real and artifical assets. Further the markets are thin and prone to greater swings – further increasing the volatility of the movements.
I believe we are viewing a classic reinforcing feedback mechanism in multiple markets. The difference this time is that the feedback is LEVERAGED.
bill,
I highly doubt 5M more jobs will be lost. That would be an 11% UE rate by late 2009.
Let’s see how quickly we lose the next 2M, before we decide if there are yet another 3M to be lost beyond that. If 2M vanish in just 3 months, as the chart predicts, I will consider the rest of their forecast. But if it takes 6 months to lose 2M more, then I doubt it.
To Marks – And thanks to you for discussing the likely consequences of a 3year reduced mortgage payment of 30%.
First, I do not know the consequences of the proposal because I do not know the status of the housing market in general at the end of the 3 year period. I’ll admit I selected 3 years in the HOPE that this mess would be all cleared up in short order and that home prices would be rising at that point.
Network news today says 40% of people that have taken advantage of mortgage makeovers fell back into bankruptcy. This proposal will have a much better chance of success if the credit counselors know what they are doing and if the economy is not putting people out of work. Seems that very few people who refuse to pay the monthly rent are good candidates. Thus this program will be of use to very few people. The limited participation should mean that credit markets will be unaffected.
But that means that my proposal will not solve the problem and may be more work than it is worth.
Again, it depends upon the level of unemployment going forward and the degree to which house prices have begun to rise in 3 years.
Because I think the people who fall into foreclosure should not all be treated the same, I am not initially supportative of your proposal to erase defaults from credit history. Only people who appear likely to make mortgage payments should be allowed another mortgage. The more I learn about this mess, the more sense I see in the old 20% down payment requirement.
It is not the case that everyone should become a home owner.
Michael Dueker:
So do you have code available for your Qual VAR? I would like to try it. Thanks.
One of my friends proposed the following cartoon to the WSJ but was rejected. I thought it was priceless.
I proposed to have Greenspan, Barnanke and Paulson all dressed in camouflage and hunter’s hats, carrying Bazookas walking into an Adirondack style lodge where you can see trophies on the wall…
a Mexican…labeled ‘Peso Crises’
a ‘Tojo’ looking Japanese labeled ‘Lost Decade’
an Indonesian Islander labeled ‘Asian Financial Crises’
a Factory Worker with hard hat labeled, ‘Manufacturing Collapse’
a housewife with a shopping bag labeled, ‘Inflation Kills the Middle Class
a computer geek labeled ‘Dot.Com Collapse
a mortgage broker labeled Housing Collapse
an investment banker labeled’Wall Street collapse
an auto worker, labeled’Main Street Collapse’
and another trophy on the table not yet hunglabeled ‘Dollar Collapse.’
Paulson says to Greenspan, “My Alan this is veryy impressive!”
Greenspan replies, “To tell you the truth Hank, I hit them all by accident. I was out interest rate targeting and no-one told me that I had the Bazooka pointed backwards!”
On CNBC last week, one of S&P’s economists offered a similar prediction about the length of the current recession: he said it would probably last until the end of 2Q09.
I am a little amused by people who predict when the recession will end. They pour through the news looking for what economic policies Obama will put into place then they predict the end of the recession obviously assuming the Obama’s policies will make no difference. Duh!
The recession will be over when the government becomes exhausted with its intervention and begins to release the market to clean up the mess.
This should be obvious but… take a look at figure one, and compare the current “trough” the author is insinuating to the one that happened in 1974. Around the -3.5 level in the first one, the descent was clearly leveling off, whereas in our present situation, the downward trend seems to be accelerating. So, I predict that this recession will end… Never.
“So, I predict that this recession will end… Never.”
That is exactly when we know that it actually is about to end.
Dear Michael Dueker –
I greatly enjoyed your postings as well as your paper. I have three thoughts / comments that if you have time, I would be very interested in the results:
1. Have you considered including CDS spreads in addition to the CP / Treasury spread? This may give a better indication of the markets appetite for risk and thus its forward opinion of corporate creditworthiness. You may also consider municipal / treasury spread as well as including CDS spreads on municipal debt. Municipal debt has ballooned over the past 8 years. If I remember correctly, only NY was in danger of defaulting during the seventies. (If you really want to be radical, you could include the CDS spread on treasuries.)
2. Currently, you are using non-farm payroll. Can you create an index that measures various employment classifications: services, healthcare / education, retail, manufacturing? As the economy has shifted, labor is less tied to productive assets and therefore, less sticky on the way up or down.
3. I read in your paper that you used a Markov Chain Monte Carlo approach to estimate your probit distribution. I was curious if you considered correlated means in the Markov estimation. Such correlation would imply a feedback / excitation mechanism. In a minor slowdown, the correlations will not have a great effect. However, if the slowdown continues the correlations are self-reinforcing. This would give you a far more dynamic estimation. It might better replicate the more tightly coupled nature of Finance and macro variables. (You implied this with your comment on Lehmans)
Although my comments may seem a desire to point the model in one direction, I believe it would be interesting if the model still converges. Convergence in previous recessions followed by a lack of convergence 2006 forward is a significant result.
Again, thank you for your work.
MDueker wrote:
“No model will forecast multiple series jointly in exactly the way that matches one’s prior beliefs, but models, with all of their warts, can help guide our thinking about possible economic scenarios.”
Reinforcing George Box’ insight “All models are wrong, but some are useful!”
Very interesting work – I can tell I’m going to be bumping up an ongoing analysis project using new analytical tools to take a much closer look at the stock market of the 1970s as a result. (At present, I’ve only made it back to September 1981!)
“In general, the Qual VAR model espouses Jim Hamilton’s view, that recessions correspond to a switching of gears in the economy, rather than simply a loss of speed due to a few randomly missed strokes within a single gear. As Hamilton has noted, if economic cycles do not signify more than the loss of speed, then the amount of speed the economy needs to lose to signify an economic downturn becomes completely arbitrary, as does the meaning of an economic downturn. In other words, the Qual VAR treats recessions as distinct events in the economy, akin to switches between high and low gears.”
Looking at business cycles through the filter of stock market performance, it’s perhaps better described as a quantum phenomenon, more akin to the dynamics of phase transition within the structure of a material, where existing connections are broken and new ones are established. The main difference obviously is that where the economy is concerned, the transition from old state to new state takes much longer.
Mr. Duecker,
Since the model uses data on core CPI inflation, are you able to assess the probability of deflation?
Anonymous writes:
“You used a Markov Chain Monte Carlo approach to estimate your probit distribution. I was curious if you considered correlated means in the Markov estimation. Such correlation would imply a feedback / excitation mechanism”
The model uses lags of the latent variable on the right-hand side of the model’s equations, so it has the dynamics, feedback and correlation that you correctly suggest are relevant to the business cycle. Thanks for the observation.
MDueker –
Thanks for your response. My thought with the correlated means was within the probit estimator. If I am not mistaken, your estimator will always be normally distributed.
The unstated assumption is that transitions from one state to the next do not affect the underlying probability distributions within the estimator. I thought it would be interesting to test the validity of this assumption through correlated means within the markov estimator.
Regarding the lags, do you allow for correlated error terms? The errors associated with the estimated mean scores of the latent variables will dampen the effects on future estimates. Correlated error terms would be appropriate if the variables are consitently adjusted post publication. For example, underestimation in one period leads to overestimation in the next period. This is particularly important as you transition from historical – correct – to future / estimates since your most recent gamma estimates have far more impact on future mean scores than previous values. As evidence we might point towards consistent upward adjustments of unemployment figures.
Again, thanks for this very insightful work.