From Bloomberg:
The U.S. lost more jobs in 2008 than in any year since 1945 as employers fired another 524,000 people in December, indicating a free-fall in the economy just days before President-elect Barack Obama takes office.
“Consumers are now going to get more and more scared at the prospect of losing their job,” said Nariman Behravesh, chief economist at IHS Global Insight in Lexington, Massachusetts. Obama’s proposed fiscal stimulus “needs to be big, needs to be bold, needs to be swift. If they can do something quickly we can limit the hemorrhage by mid-year.”
…
The pictures pretty much summarize the current outlook, so without further comment…
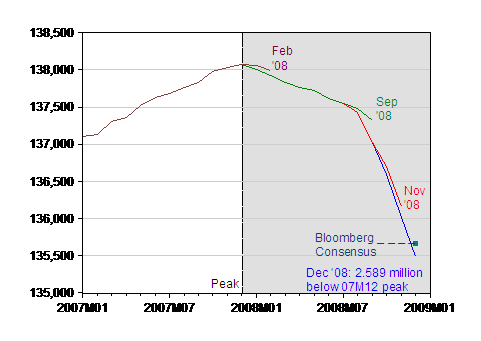
Figure 1: Nonfarm payroll employment, seasonally adjusted, various releases. NBER defined recession dates shaded gray (assuming recession has not ended by 2009M01). Bloomberg consensus for December in teal square. Source: BLS, employment situation, various releases, via St. Louis Fed FRED II, Bloomberg.
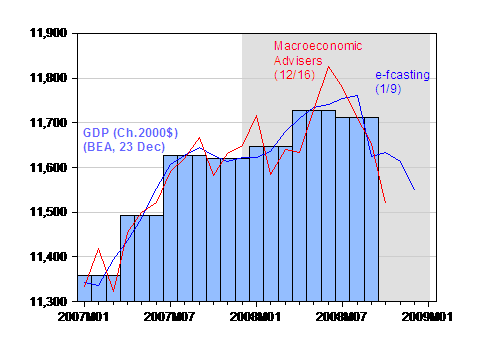
Figure 2: GDP (light blue bars), GDP from e-forecasting, 1/9 (blue), and from Macroeconomic Advisers 12/16 (red) in Ch.2000$, SAAR. NBER defined recession dates shaded gray (assuming recession has not ended by 2009M01). Source: BEA, GDP release of 23 December, e-forecasting 1/9 and Macroeconomic Advisers [xls] 12/16 release.
Update, 11am Pacific In response to Brian Quinn‘s comment on part time work rising.
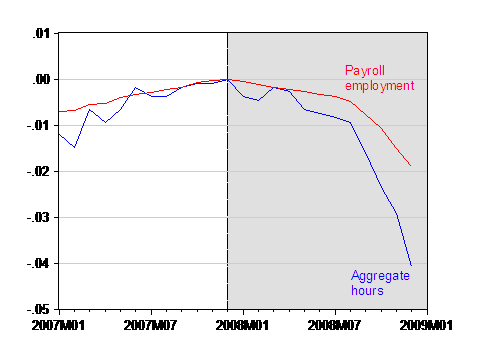
Figure 3: Log Nonfarm payroll aggregate weekly hours (blue), and Log Nonfarm payroll employment (red), seasonally adjusted, normalized to 0 in 2007M12. NBER defined recession dates shaded gray (assuming recession has not ended by 2009M01). Source: BLS, employment situation, December release, via St. Louis Fed FRED II, and author’s calculations.
Update, 3:10pm Pacific Since GK and barkingtribe are exercised about the lack of normalization, I show the 12 month change in employment (blue) and aggregate hours (red) in the figure below.
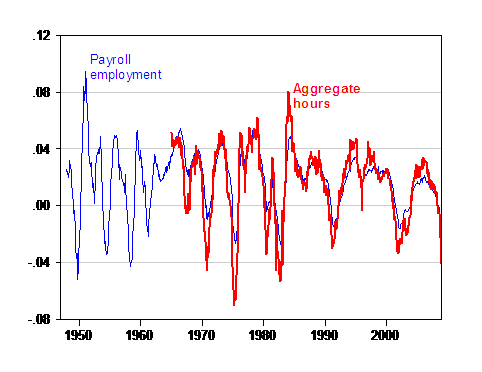
Figure 4: 12 month growth rates in nonfarm payroll aggregate weekly hours (red bold), and Nonfarm payroll employment (blue), seasonally adjusted, calculated as 12 month log-difference. Source: BLS, employment situation, December release, via St. Louis Fed FRED II, and author’s calculations.
In the BLS report, I noticed the relatively small amount of damage in the financial sector. It seems that the financeers are keeping their jobs, while others are losing them. Interesting..
The other thing I noticed is that, 1 in 7 employed people in the private sector, work in health care.
1 in 7 of all people employed (public and private) work in the private education/health care sector.
If you are trying to recover an economy, turning everybody into a ditech teacher or a health secretary does not seem to be a smart way to do it.
One item of note in this report is that I would have expected far greater reductions in retail employment than 67,000 positions. From what I have obeserved anecdotally and from retail sales reports, this should have been larger. In 2002, which was nowhere near as negative, we lost over 100,000 retail jobs in December: http://www.bls.gov/news.release/History/empsit_01102003.txt
My suspicion, being very familiar with retail employment practices, is that many full time employees were reduced to part time positions(below 32 hours a week). Also, hours worked by part time employees were probably significantly reduced rather than those positions actually eliminated. We did see the broader measures of unemployment, which include shifts from full time to part time move, move up a good deal more. Perhaps that’s where this is reflected.
Since I have your relatively undistracted attention ,Menzie. I can’t help making the observation that economists have absolutely no clue what is going on in the economy. They seem to have a firm grasp of finance, but not economics.
From the point of view of a guy who was a PhD canidate in theoretical physics, the state of economics, as a science, seems exceedingly rudimentary.
In some sense this is good for me, I never got a PhD in Physics, but physics is heavily mined territory with lots of really smart miners still at work. If I get a PhD, I will try in economics, there are still diamonds lying on beach here.
Just to highlight what I am saying. Is there any global economic model commensurate in complexity and sophication with the computer models for global climate change? The difference in sophistication is striking, I think.
vorpal – as a convert to finance from engineering, I know where you are coming from. Complex computer models? Are you kidding? Up until recently the entire investing community was somehow convinced that the whole global economy could be controlled by 1 little interest rate, determined by 5 geezers in a board room in DC.
It is important to keep in mind that economists are working with vastly different measurement tools than those in the physical sciences. When you take a temperature reading, measure wind speed, or record the impact of objects colliding, the results are not ambiguous. Economists are trying to measure human desicions and actions. Very little work can be performed in a controlled environment. What drives people to create, purchase, save, or do something else is not clear to see. You are right that the modelling techniques have a long way to go. I only suggest that comparisons to the physical sciences leave out the inherent difficulties in data gathering and integrety that are inherent in the social sciences.
Models of any type are really not going to work like they do for climate analysis. There are hundreds of millions of intelligent autonomous agents working to maximize their happiness, and who will include the results of successful models in their analysis (passed down indirectly by talking heads), thus causing disruption to the original model.
So economics is far worse than physics in that it may not even be possible to model it.
@vorpal:
There is no longway distance between (macro-)economics and politics, compared to the other sciences you mentioned.
Menzie Chinn is with the left-side party of the nation, aren’t you ?
BTW: I am an outsider, from Europe, but got a PhD in IT. And if you, vorpal, consider doing economis you would be able to engineer the next bubble, same way as the housing bubble has been engineered- has been a great success, Richard Fuld got 480mill in bonus.
What struck me was the 2.815 million job loss, not seasonally adjusted, December 2007 to December 2008. Also the 954 thousand job loss November 2008 to December 2008, not seasonally adjusted. I would bet that the seasonally adjusted numbers will be significantly changed.
vorpal should consider the following remarks of Nobel prize winner Paul Krugman:
An Indian born economist once explained his personal theory of reincarnation to his graduate economics class, Paul Krugman writes in the opening paragraph of his Preface to Peddling Prosperity. If you are a good economist, a virtuous economist, he said, you are reborn as a physicist. But if you are an evil, wicked economist, you are reborn as a sociologist. Krugman then continues, A sociologist might say that this quote shows what is wrong with economists: they want a subject that is fundamentally about human beings to have the mathematical certainty of the hard sciences . . . . But good economists know that the speaker was talking about something else entirely: the sheer difficulty of the subject. Economics is harder than physics; luckily it is not quite as hard as sociology. (1994:xi)
vorpal and PCLE, this is exactly what I mean when I say we can not have confidence in our economic forecasts… Economist should follow the maxim, ‘First, do no harm’ When it comes to fiscal and monetary policy… we might be better off doing nothing.
Menzie, I am interested in your opinion of the Payroll employment numbers vs. the telephone survey for the unemployment rate. The stock market seems to trade off of payroll numbers, but I find the telephone survey to be more informative.
The ‘most job losses in a year’ line, without adjusting for population size, is stupid, dishonest, lazy journalism.
Actually, the slope of job loss is steepening, which means a bottom is near.
Is there any global economic model commensurate in complexity and sophication with the computer models for global climate change? The difference in sophistication is striking, I think.
Not being an economist or a physicist, but an engineer, my take is that, while perhaps sophisticated, climate models are so raught with uncertainty in the data calibrating the model as to be totally useless.
Look, engineers use computational fluid dynamics software, which uses the same equations as the climate models. CFD done without calibration via experimentation are not very good.
If I need to do experiments to determine some of the factors in a small piece of engineered equipment, how on earth is a climatologist going to calibrate s model of the entire earth, for all time?
The hubris of the climate modelers is not unlike the hubris of the risk modelers at the heights of the bubble!
That’s not to say that climate change is bunk. But climatologists need to build a “body of evidence” and use observational techniques, not unlike the social sciences.
The last chart showing Aggregate Hours dropping away from Payroll Employment suggests to me that managers have not been able to terminate jobs as fast as the needed work hours decline in their businesses. If so, it means that we’ll see several more months of 500K+ job losses.
In about eighty years there’ll be another economic catastophe except that in a one month period they’ll lose two million jobs. The MSM will howl, they’ll banter about a newly elected government to spend the fifty trillion dollars to stabilize the markets.
Yep, the Keynesian’s will be back….
GK: Actually, the slope of job loss is steepening, which means a bottom is near.
Paraphrasing Inigo Montoya, I do not think the second derivative means what you think it means.
I like that first graph, Professor.
BLS overshooting high, chasing the market down.
Hilarious.
Looks like they need more ‘death’ in their ‘birth/death’ adjustments.
“Paraphrasing Inigo Montoya, I do not think the second derivative means what you think it means.”
I know what it means, that the BLS does a bad job of preliminary reporting.
But the second meaning is that the rate of job loss is now so high that the bottom is near. We lost 2M jobs in the last 4 months. If we lose another 2M in the next 4 months, that is the bottom, and is just 4 months away.
“Up until recently the entire investing community was somehow convinced that the whole global economy could be controlled by 1 little interest rate, determined by 5 geezers in a board room in DC.”
I assume this was said in jest, as the “investing community” I’ve been watching has been saying anything but this for a very, very long time.
In any time series model, you have prediction intervals that reflect uncertainty. Also when the data generating process changes, then forecasts are going to contain large errors.
Thank you all for your comments. I do have a couple of responses.
1) Economists do form mathematical models. So the notion that ‘trying to put numbers to a human endeavor is vain’ argument is moot. Models are already being made, the question is how good are they?
2) Although the notion of economics may seem too human to predict, he fact remains, that tracking money is quite possible. Money is a measurable quantity. The flow of money can be observed and given those observations, patterns may be deduced…much like the weather. We can’t predict the weather months ahead of time, but when a hurricane strikes we do understand it and can respond. The current economic hurricane does not even have this level of clarity. Where’s the ‘satellite photo’?
3) Fluid dynamics can be viewed as studying 10^30
autonomous particles, yet we still manage….and we get better every day.
4) I am disturbed by the amount of characterizations used in economics. “Keynesians” and “Monetarists” and “Neo-classicalists”, not to mention “conservative” and “left-leaning”. Characterizations such as this are the province of doctrinal thinking. Science is anti-doctrinal and the use of these pigeon-holing terms strikes me as tacky, puerile and jejeune.
Again, thanks all , for your input.
One more thought, just from the quality and diversity of the responses here, I get the feeling that if we really got serious about understanding economics …and put a sizable number of our sharpest minds to task, a lot of prgress could be made.
Jesus! “jejune”, vorpal, I don’t think I’ve seen that one since I last read Austin’s, ‘Sense and Sensibilia’.
Might as well fling it back into the foray now that even Buzzy comes up with an engineering ticket.
Better to rescue 1 word and sully one’s reputation in the view of a scant, scant few –than to let this opportunity pass for enhancing said reputation in the eyes of the many, many, Lily Tomlins here. That literary…bravery.
Since I have your relatively undistracted attention ,Menzie…. iz what did us in, vorp.
Can you extend the ‘aggregate hours’ chart back for 10 years? Or otherwise point me to where I could get the data?
I am curious to see if the aggregate hours worked number has fallen all the way below 1999-2000 levels.
GK: You’ll have to go to some historical archive and splice the series. What I’ve got plotted is the series online at FRED II.
vorpal: In the right hands, the use of the terms “monetarist”, “Keynesian”, “neo-classical” can be useful as a shorthand. And that is exactly how professional academic economists use the terms. I agree that standard has not always been conformed to in the blogosphere.
The U.S. lost more jobs in 2008 than in any year since 1945.
Though in 1945 the labor force was under 58 million and today it is over 154 million — so the claim is somewhat exaggerated.
Still, that didn’t keep “Worst Job Loss Since 1945” from being today’s Page One headline of the WSJ, from being in every other NYC paper, and from turning up in more than 3,000 Google News hits — so the press seems to be really running with this meme.
I ran FRED numbers for annual employment and size of the labor force post-WWII into a little chart and it turns out that, relative to the size of the labor force, 2008’s job losses weren’t the worst since 1945 after all (nor even 2nd worst).
In reality 1983 was by far the worst year for the employment picture (I was there, and remember) so the newspapers if informed should be warning of “Worst Since 1983”, though that’s hardly as grabbing, so we know why they don’t. And as to “worst since the Great Depression” which turned up 11,000 Google News hits … we should wait to talk about that until we hit 1983’s employment levels, God Forbid.
I’m not at all diminishing today’s problems, they are bad and likely to get seriously worse — but it would be nice if the press informed the masses with an accurate perspective instead of scare-stat headlines.