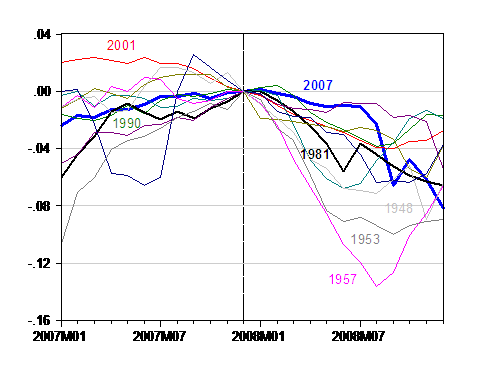
Since Minneapolis Fed and others are posting various comparisons of employment and output during recessions (and pseudo-recessions — see the discussion at Spencer at Angry Bear), I thought I’d post an analogous picture of industrial production.

Figure 1: Log industrial production (Dec 2008 vintage), normalized to 0 at peak. Current recession (blue), 1981 recession (black). Source: FRB via FRED II (accessed 1/16/09), and NBER.
Spencer beat me to the punch, and has additional details, but I think a comparison against all the individual actual post-War recession trajectories for IP is useful, keeping in mind industrial production is a smaller proportion of GDP over time. (Of course, one probably wants to think of “severity” in the context of the “Great Moderation”, in which case, this decline looks pretty remarkable.)
Update 12:20pm Pacific
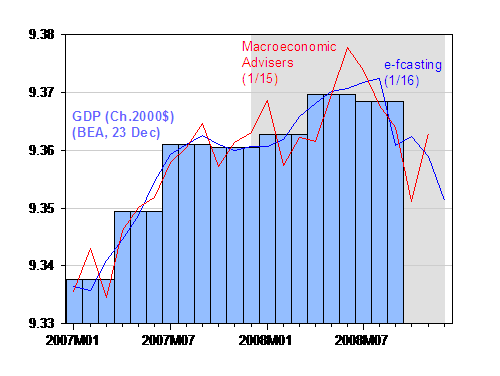
New estimates of monthly GDP are out.

Figure 2: Log GDP (light blue bars), Log GDP from e-forecasting, 1/16 (blue), and from Macroeconomic Advisers 1/15 (red) in Ch.2000$, SAAR. NBER defined recession dates shaded gray (assuming recession has not ended by 2009M01). Source: BEA, GDP release of 23 December, e-forecasting 1/16 and Macroeconomic Advisers [xls] 1/15 release.
Update 9:50pm 1/20/09

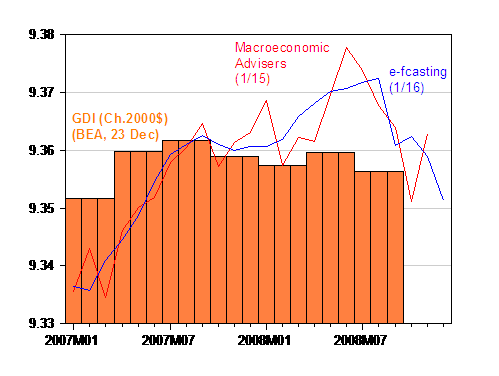
Figure 3: Log of GDI deflated by GDP deflator (light orange bars), log GDP from e-forecasting, 1/16 (blue), and from Macroeconomic Advisers 1/15 (red) in Ch.2000$, SAAR. NBER defined recession dates shaded gray (assuming recession has not ended by 2009M01). Source: BEA, GDP release of 23 December, e-forecasting 1/16 and Macroeconomic Advisers [xls] 1/15 release.
Well, both your chart and Spencer’s look like a bottom is not that far unless we are entering a depression.
Hmmm… It looks like by this time, every single line, except the current one, had started raising from the bottom. I do not like that.
Somebody has to play Pollyanna so why not me?
Referring not to the real economy (all gloom and doom) but the financial market, which has been the driver of the real economy and the justification for the huge govt stimulus/bailout bill (with the financial market all locked up monetary policy is ineffective so the govt has to take direct action) there’s a recent report of “happy news” over at Calculated Risk
“TED spread is at 0.99, sharply lower … The peak was 4.63 on Oct 10th …normal spread is around 0.5.
“The three month LIBOR decreased to 1.109% … peaked (for this cycle) at 4.81875% on Oct. 10…. Imagine all those adjusted rate mortgage loans tied to treasuries or even the 3 month LIBOR? The rates are looking pretty good!
” The A2P2 spread as at 2.23. This spread has seen a huge decline in 2009.
” The two year swap spread from Bloomberg: 52.25. This spread peaked at near 165 in early October … hasn’t been this low since mid-2007.”
VoxUE, which predicted this recession before others did, accurately, is now predicting the recession will be over
“sooner than you think” (accurately?) on similar grounds, and warns that the “stimulus” had better be enacted quickly or it will be too late (just like in standard analysis) due to improving financial factors.
Personally it looks to me a sure thing the real economy will get worse if only due to momentum, but financial markets can turn around quickly, turn better as fast as they turn worse. (And think how fast they changed from six months ago, when people were debating wether the Fed’s rates were too low and causing that whole commodity price explosion.)
Suppose six months from now the financial markets are back to normal, nobody is thinking “liquidity trap” any more than $200-a-barrel oil, and monetary policy is looking as effective as ever. What’s the contingency plan for the two-year stimulus program then?
If one takes the consensus forecast for IP and computes the peak to trough decline, the recession will be the 5th worst since 1948 in terms of IP. The decline works out to be 7.4%, compared to an average decline of 7.0% for recessions over that time period. The 1990 and 2001 recessions had a decline of 3.4% and 4.1%, respectively. Pretty remarkable, as Menzie says.
The focus on rates and relative rates is interesting. However, economic activity is predicated on borrowings not on the rates charged for that borrowing. TED’s interesting, but volume of borrowing more so, or value thereof.
It is quite difficult to detect, in the data not the anecdote, the drying up of the credit market, except the financial commercial paper market, but that was a recent bubble anyway.
Looking at Fed databases just doesn’t show much of a credit problem. So where is it? It seems like a confidence issue in multiple meanings.
Menzie, excellent graph.
Isn’t this but more evidence that the recession did not in fact begin in Dec. ’07? It didn’t start until gas prices skyrocketed in the summer.
Jim Glass: While I think the credit markets might become unfrozen in a few months, to the extent that spreads are reduced to more normal levels, I think credit will still not be flowing freely exactly because the process of deleveraging will be long and painful. See this post, as well as this empirical study. Hence, the scenario you lay out is, in my opionion, implausible.
Jonathan Willner: I thought in basic economics, both prices and quantities were of interest. If spreads represent relative prices, then I think discounting that information is inappropriate. See, to begin with, this post.
Buzzcut: Since NBER defines a recession from peak to trough, and employment and industrial production look pretty unambiguously centered at end-2007, I go with NBER’s BCDC. (Recall that GDP will undergo a number of revisions come mid-year, and even subsequently, as new data comes in, and so the time profile of GDP will change as we get more information, as discussed here.)
Your updated graph ends in September, if I read it right, leaving the vital last quarter of 2008 unaccounted for. Up to our eyeballs in numbers, but still lacking crucial information.
The discussion on the Spencer website is wonderful, leading to much needed caution in accepting numbers not quoted from official sources. And as you note, official numbers are revised. Even the revisions can be the from the best available data, but the best available data may be incomplete – off by a small amount.
That’s all very nice data, but how did the prewar recessions look like, e.g. the recessions after 1929 and after 1938?
ReformerRay: Well, 2008Q4 data won’t be published by BEA on January 30th; consider the Macroeconomic Advisers and e-forecasting estimates as “nowcasts” of Q4 GDP.
biologist: Feel free to generate the pictures (if you can include all the lines legibly). The NBER dates are here and the IP data here.
I would like to see the other years normalized at the peak of industrial production. Not at the start of the recession.
It seems to me that the drop-off in industrial production is not as bad then – not to deny the severity of the situation.
Buzzcut: Since NBER defines a recession from peak to trough, and employment and industrial production look pretty unambiguously centered at end-2007, I go with NBER’s BCDC.
Menzie, look at the data for 2001. The peak of industrial production was 6 months BEFORE the start of the recession. In fact, that recession looks a lot like this one, if you move the start of the recession 6 months back.
So the NBER is using 2 different sets of criteria for calling a start of recession. What’s the deal with that?
I don’t think that what the NBER has done is as cut and dried as you make it out to be.
Buzzcut: All four indices that NBER BCDC focuses on peaked at around the end of 2007 (or earlier!), while only the monthly GDP index, which BCDC consults, kept on rising. Please refer again to this post regarding graphcial depictions of the four key variables, and this post regarding gross domestic income (which peaks at 07Q4). Pretty cut and dried in my book, and in my mind is likely to become more cut and dried as GDP is revised downward in the mid-year benchmark and in subsequent revisions.
Regarding the 2001 recession, see this post.
Buzzcut: See also Figure 3, which shows real GDI.
Menzie, did you remember that ’06 post, or did you have to search for it? Nice to be able to pull something like that out of a hat!
The 2001 recession and this recession have data series with serious “sawtooth”. You yourself said in the ’06 post that this makes recession dating difficult.
Ultimately, the employment graph has the sharpest peak with no sawtooth. It is also the metric that most people probably feel defines recessions. It strongly makes the case for Dec. ’07 as the start of the most recent recession. So I understand why they made their determination as they did.
It is the ’01 recession that is fishy. If we were not in recession before March ’01, we were in a very volatile economy. Not surprising considering what was going on politically at the time.