When good news comes, what should we expect to see?
The graph below plots the quarterly percentage change (at an annual rate) for real GDP and some of its key components since 1947. Calculated Risk has noted that the typical recession pattern is for nonresidential fixed investment to begin its decline after residential fixed investment and consumption, and not begin its recovery until after housing and consumption have begun their recovery.

|
This pattern emerges more clearly when you look at the average behavior of each component over the course of the earlier historical recessions.
|
Here’s the severe 1981-82 recession in isolation:
|
And here’s what we’re seeing so far this time. True to form, nonresidential fixed investment had been holding up reasonably well during the early part of the downturn, but has now started to decline significantly. That process has enough momentum that it is hard to see nonresidential fixed investment picking back up before we see some recovery from consumption spending.
|
And how reasonable a prospect is that? Plunging output and employment are big negatives for consumption spending, as is the huge drop in stock market and real estate wealth. The home equity that remains has become harder to extract, and a general contraction in household debt relative to GDP seems unavoidable. These latter factors presumably have played an important role in the surge in private saving as a percentage of disposable personal income.
|
But a couple of other factors are likely also contributing to these higher saving rates where the near-term dynamics could favor an increase in consumption spending. The first is the fact that gas prices are about $2/gallon lower than they were last spring, which has freed $280 billion for consumers to save or spend on other things.
|
Pessimism itself is another potentially changeable factor that is making a separate contribution to what we see going on. When sentiment turns around, spending will pick up, and I don’t see why we’d rule out the possibility of some improvement in sentiment. The preliminary March reading of the Reuters/Michigan index of consumer sentiment was at least slightly up rather than down.
 |
With all eyes on consumers, it’s interesting that the average value for retail sales in January and February was 1.8% above the dismal number for December.
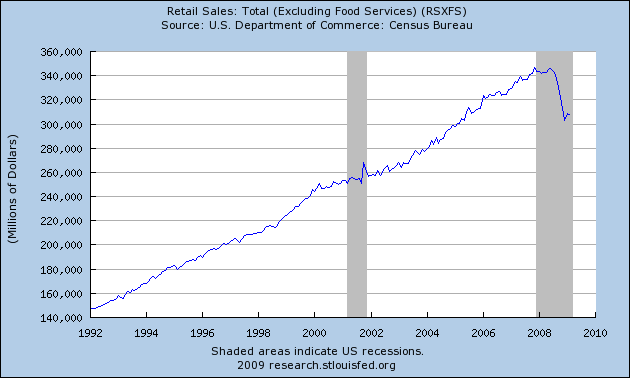 |
WSJ Real Time Economics relates Morgan Stanley economist David Greenlaw’s concerns about seasonal adjustment problems with the January and February sales figures.
But I nevertheless take some encouragement from these numbers.
Technorati Tags: GDP,
recession,
macroeconomics,
economics
“Has the Economy Hit Bottom Yet?” by Vikas Bajaj in the NYTimes on March 15, 2009 at p. WK1
Great examination of the components of recovery.
I don’t know if reliable data exist, but are the trends for pre-WWII contractions the same? Given that some key aspects of our current recession (near deflation, collapse of consumer credit) have more in common with pre-WWII rather than post-WWII, I’d love to see what some of these graphs look like when extended back further.
The primary reason real income and retail sales ticked up in recent months was the impact of collapsing oil prices on real incomes. Real incomes rose despite the point that nominal wage and salary disbursements were falling.
But oil prices appear to bottoming.
Thus, the greatest risk to consumer spending and an end to the recessions appears to be rising oil prices.
January real PCE was 0.1% above the fourth quarter average and the upward revisions of January nominal retail sales from a 1% gain to a 1.8% gains implies that January real PCE on durables and nondurables will be revised up.
In the fourth quarter falling real PCE accounted for 3.0 percentage points of the 6.2% drop in real GDP. It now look possible that first quarter real PCE could be above the fourth quarter level. Offsetting this will be a massive inventory drawdown that will be a big negative for first quarter real gdp.
The big question in my mind is the seasonal adjustment for January and February consumer spending. Since X-mas sales were so weak we are not getting the normal drop in not seasonally adjusted sales from December to January and part of the seasonal adjustment has this big drop built into the adjustment formula. So because December was so weak, are the seasonal factors overstating the January and February spending.
I do not know, but it is something I worry about.
Dr. Hamilton, I think you should continue your piece on the energy shock. You hit upon key components, but there’s much more to it.
With gasoline price increases, we saw increasing congestion, until ’08 when things finally broke down. It isn’t until the economy halts that we see decreasing congestion. We become more inefficient before roads clear enough to make trips shorter and more fuel efficient.
I think one key aspect is the point made in the papers you linked, energy price increases lead to greater reduction in consumption than the additional cost of energy. This is only natural, as the only substitutes for energy are labor, animal or human. As the cost of attempting to do business increases and the rewards decrease, risk becomes greater, uncertainty reigns.
And, consider that there may generally be two flows of traffic. Commercial traffic that moves at it’s own pace, slightly impeding car traffic. Commercial traffic long ago adapted practices that were fuel efficient for the driver. But, when excessive price pressures drove car drivers to improve their fuel economy, the gains they sought didn’t exist. They adopted behavior similar to trucking that didn’t apply. Commercial traffic improved, but car traffic got worse.
We became less productive. Until the last half of the year, we’ve been using more time and fuel to get the same work done.
I hate to say this, but when, and you’re not the only person doing this by any means, you start picking economic figures looking for any correlation that might signal an upturn, it leads me to believe that you’re not sure how the various figures actually relate to each other, if at all. That’s fine with me, and certainly no reflection on you personally, but, if that’s the case, we might want to know if that tells us something profound about how we interact with the world. In other words, what would it mean if we can’t correlate these numbers or ascertain any real causality.
It reminds me a bit of skepticism in philosophy. It’s not so much that the skeptic can convince us that the world doesn’t exist, as much as the fact that our inability to refute him tells us something profound about how human beings interact with each other and the world.
Possibly, none of what I just said makes sense in economics, but it’s the way that I just read your post.
You mentioned Scott Sumner and his blog
http://blogsandwikis.bentley.edu/themoneyillusion
in a previous post. I went there as a result – and do agree with you that his solution would work – and fast. It is the only workable solution we have. Fiscal policy is too slow and too small. The Obama people are too timid – intimidated by Congress. Have you been back there since? I do think it is real good.
Nice work.
Something worth noting is the slope of the residential investment line in the current recession vs the others. Eyeballing it, we look about 2 quarters away from stabilization. The enormous used home inventory needs to be obviously worked off before builders have any incentive to spend. Interestingly enough, GDP is relatively stable in counterpoint to res. investment this time around.
The uptick in PCE looks promising and may turn out to be the beginning of the end the down slope. But, more likely in my view, the decline in PCE will resume, if only because it must.
My basic observation is that US consumer spending was boosted to over 70% of GDP – a level that was completely impossible to sustain indefinitely. It follows that the household sector as a share of the economy must contract significantly and permanently. Since the economy is shrinking while household savings are also being rebuilt, consumer spending is likely to fall very substantially – maybe by a cumulative 20-25% from its peak levels. We are probably quite a bit less than halfway through the adjustment in household spending.
It also follows that consumer spending is very unlikely to become the driver of renewed expansion: the government sector can cushion the shock to a degree, but private business will have to become the next driver of GDP growth. That cannot happen until profits stabilize, balance sheets are re-built and excess capacity has been liquidated. This will take a long time – maybe as long as another 2-3 years – and will only occur when conditions in credit markets have calmed and banks feel they can lend without risking their scarce equity.
As an observer, it seems to be that there is an expectation that everything will soon enough get back to “normal”. This begs the question: what is “normal”? Certainly, the runaway debt-creation, over-investment and excess consumption of the last 20 years was not normal.
While this may not be acknowledged in the language used to talk about economic events, it is certainly evident in economic behaviour: people are spending less, borrowing less and saving more. It is back to the Mom-and-Pop economy of 50’s.
Very nice analysis, Professor; excellent depiction and summary of the data.
Me, I think this downturn is driven by household debt relative to income. Analyzing the latest Z-1, while household debt came down modestly in ’08, it is by no means coming down at a fast enough rate.
Before, I forecasted that this downturn would trough in ’12. Given the slow rate of writeoff/paydown of household debt in ’08, unless we writeoff/paydown household debt at a faster rate than we did in ’29-’33 (8% per year on average), I now forecast that this downturn will trough in ’14.
Bernanke, Geithner, Summers, and Obama: quit forestalling the inevitable, and allow the household debt to get written off (as paying it down is not going to happen in the face of falling GDP), and written off fast.
Nice work. The best article in several weeks.
One thing that may surprise to the upside is financial sector earnings. Now that the yield curve has 2-3 points of steepness, banks may profit a lot.
Another positive is that technology sector inventory is almost fully drawn down. A rebuilding with new products is imminent.
Lastly, of course, is lower oil prices.
I still say :
Q309 trough in NBER recession
131M jobs at bottom (2.7M more jobs still to be lost)
UE rate touches 11%
Jobless recovery into 2010
Note that I am not speculating on the steepness of the recovery after the Q309 trough, nor am I discounting the possibility of a double-dip recession in 2011-12.
“I now forecast that this downturn will trough in ’14.”
A 6-7 year recession? Note that even during the Great Depression, the longest recession was 4 years (1929-33), followed by 3 years of weak recovery, and then another 2-year recession in 1937-38. It was not a continuous 10-year downward slope without troughs.
Actually, the more I look at Data from the 1974-82 period, the more I think that it would have been a Depression if not for 1 simple factor :
The huge expansion in the workforce due to Baby Boomers reaching adulthood AND women (boomer and pre-boomer) entering the workforce for the first time.
The workforce was growing greatly. If not for this, 1974-82 would have been a depression. It was a period of 2 recessions (1974-75 and 1980-82) with just a brief 4-year expansion from 1976-79, where the inflation rate and Unemployment rate were both poor, and the stock market didn’t rise much.
Eventually, we will find out of 2001-2009 was a similar period, due to the weak expansion between recessions. Or that 2008-17 is such a period, that we are just starting.
I expect to see the stock market come back long before the rest of the economy. The profit margins for non-financial corporations, as shown on a chart published in every edition of Survey of Current Business, is still high, relative to the historical average (course their data is 4 to 6 months old). But the downward slope only went down for 2 years so far and the latest data suggest stabilization.
I think corporations are downsizing from panic and as a result they will continue to be profitable.
If this view is what happens, it is another illustration of how the U.S. system is rigged against the average person.
“If this view is what happens, it is another illustration of how the U.S. system is rigged against the average person”
Then which system is better for the average person? Cuba? North Korea? Why are so many people coming to the US just to reach the level of the average American? Why are average Americans not leaving to go elsewhere.
Most of us think this is the best country in the world. It is good because our parents tried continually to make it better. We will continue to be in trouble once we lose the desire for improvement. The rest of the world is certainly not standing still. There is no reason to accept the present distribution of rewards for our common efforts. I veiw patrotism as including a strong desire to live in a better country.
In the typical recession, the Fed raises rates and housing construction falls. When the Fed cuts rates, housing recovers. That will not be the pattern in this cycle. Rates are already quite low and the housing industry is struggling with a huge inventory of vacant property. Regardless of rates, there is no reason for housing construction to show a significant increase for at least a year. Past patterns are not likely to be very helpful in anticipating the coming recovery.
I’m curious why the first four graphs do not seem to show any evidence of the boom in spending, credit and residential investment that happened in 2005-2007? They look like pretty normal years.
Regarding gasoline prices, they’re at unsustainable levels. The refiners are losing a frightening amount of money. They lose money on every gallon they sell.
There is going to be a reckoning, and quick. Independent refiners with referneries far from major population centers are going to go out of business, and refineries will close. That will cause the price of crude oil to drop at the same time that gasoline prices go up.
My advice is to fill up now.
I will admit that GK and me are off topic but I want to kick the can once more.
CEO’s in the U.S. are overly concerned with hiting the numbers every quarter. That was the downfall of Enron. And GM would have been a better company today if they had focused further down the road instead of paying increased dividends when Japan agreed to withhold shipments to the U.S. temporarily (ancient history).
The U.S. stock market overreacts to every slight change in company prospects every quarter. CEO’s cannot afford to ignore the stock market and its reaction to every quarterly profit report.
I think the Japanese and maybe the Germans have developed a better system. I say maybe because I don’t really understand either the Japanese or German system. My impression is that they manage to focus company management further down the road than this next quarter’s earnings.
My general point is that the U.S. stock market, as it currently operates, manages to concentrate an excessive amount of the rewards for good corporate behavior into the hands of today’s investors rather than the people who work in the trenches to enable a corporation to succeed or the population that will be employed by that corporation 10 or 20 years from now.
I am an admirer of Peter Drucker. One of his ideas that did not “catch on” was his proposal to force very large corporations to buy out equity investors and depend upon issuing bonds to secure funds to expand or keep operating. He argued that depending upon bonds would cause firms that were in trouble to go broke quicker, which he viewed as a positive. This idea floundered because he did not have a good answer for the question of how the top management would be picked and replaced. In my view, this issue could be better handled than allowing CEO’s to pick board members who then agree with the CEO. How I don’t know. But someone should be working on this question.
This quote, from an article about Peter Drucker, is certainly off topic. “Drucker taught that management is a liberal art, and he infused his management advice with interdisciplinary lessons from history, sociology, psychology, philosophy, culture and religion.[13] He also believed strongly that all institutions, including those in the private sector, have a responsibility to the whole of society. The fact is, Drucker wrote in his 1973 magnum opus, Management: Tasks, Responsibilities, Practices, that in modern society there is no other leadership group but managers. If the managers of our major institutions, and especially of business, do not take responsibility for the common good, no one else can or will.[14
End of sermon.
I am tired of seeing people quote the yield curve as a positive for the banks in light of Citi’s “big news” the other day (which I buy about as much as real estate on the Moon) – the yield curve had over 300 bps of positive spread a YEAR ago. It began improving in August of 2007 and has been positive ever since. This is not new, and not news. If anything, it is moneyflow out of capital markets and into bank deposits.
Could you possibly post the spreadsheet for the first graph. It’s something I would like to play around with but will not really have the time to recreate it from the data. Thanks.
ReformerRay,
I do not think it is CEO who focus too much on quarterly earnings, but the media.
CEO’s focus on meeting their incentive compensation goals. If their incentives are based on quarterly EPS, that is what they will target.
Incentive comp should be based on very long term and broad metrics, such as five year stock total return relative to peers. Comp should be paid in options that have sell restrictions. Options are good only when they are granted out of the money, vested over time and not backdated.
I am a big believer in Jensen and Meckling.
Question: Mr. Hamilton, could you regraph the 81-82 recession chart with the same vertical axis values as the previous and current recession graphs. The 80 hit 20% quicker than current but looks like NRI both hit 5% at the time res hit 20%.
I think the steepness of the current, is deceiving as it relates to 80’s IMHO
TYIA,
FD
Forgot, left out how does unemployment track with the 3 graphs as well?
A few recent papers (such as Reinhart and Rogoff, or Claessens, Kose and Terrones) have suggested that credit-related recessions, or those associated with asset price collapses, seem to be more severe and longer lasting than typical recessions. Anyone out there know of paper that does the stylized facts for receoveries from credit-related recessions?
one: First graph was created not with a spreadsheet, but with RATS (program here, data here). Others from Excel spreadsheet here.
FD: Links above, feel free to roll your own.
Thanks Doc…
Been a long time since i had to roll my own… plus,
I’m a chart tard and dependent on my fellow man…too much reliance on you and CR I guess, you guys started feeding me fish and stopped teaching me to fish…shame…
I think some exxcellent comments made above. the points I thought interesting were.
Residential investment
1. Usually the Fed has scope to loosen monetary by the middle of the recession. That isn’t the case this time so that doesn’t lead to a bounceback in housing demand and residential fixed investment.
2. The huge housing inventory out there is much larger than usual. (This inventory doesn’t even count the very large quantity of semi finished housing estates whcih won’t need as much investment to bring to market as new housing.)
In addition I’d point that residential investment has tumbled to such a low level that any bouncback that looks reasonable in percentage terms is going to be very small in dollar terms and so a small contribution to real GDP and ending the recession.
Consumption
1. This recession is different in that the consumer is much more highly indebted and they start the recession with a savigns rate of zero. This doesn’t suggest there will be a sustainbale bounce in consumption.
2. To the extent there is a significant bounce there is then likely to be another crisis within a year or two as the reality of lack of savings and too much debt becomes apparent.
Timing of end of recession
An additional point about timing of recovery. The graphs suggest taht consumption and resientail fixed invesment begin to bounce abotu halfway through the recession. Given that this hasn’t happened yet it looks like at least another 15 months of a recession. And that is even if we dismiss the above points and still assume that residential investment and consumption are going to bounce and have a strong impact.
These charts are a bit of a tease. Earlier recessions were dominated by collapsing housing, autos and inventories, and followed by their sharp recoveries. Given the nature of the recession (a balance sheet repair process) it seems unlikely that these items can lead us to a “V” shaped recovery.
Perhaps the data could be reformatted to reflect to highlight potential sectors of strength (govt spending for one).
I would look to the fundamentals to predict the recovery. I think the ratio of consumer debt to income is an important fundamental that seems to be lacking from your analysis. For example, what pattern of increased savings rates would return consumer debt to historic norms? How long would such elevated savings need to continue? What savings would be required, given the return of asset values to more realistic levels?
The comparison with other recessions also seems to me to be singularly inappropriate. Perhaps such comparisons should be limited to cases where the fed suffered from a liquidity trap, which case is not even included in the above. In all, I am disappointed in the analysis.
I agree with the comments made by Steve van Emmerik.
Why not just ask everyone! Would the average answer be close because consumer confidence plays a large part in recovery? If lots of people enter an estimate on http://www.recessioncountdown.com maybe we’ll find out?
Professor Hamilton I request that you add “Net Exports of Goods and Services” to your charts. It is roughly comparable in size to Residential Investment and might prove to be one of Chairman Bernanke’s “green shoots” going forward.
Greetings – first time poster. I know this blog has been dormant for a few months, but I just found this website, and I think it’s an interesting thread. The charts and graphs displayed in the article were interesting, but my concern is sometimes we don’t see the forest through the trees. You can’t always predict future events from previous trends, especially when the playing fields are not level. I’ve yet to see convincing evidence of a recovery – at any point yet. I see a couple of bright spots in a multitude of clouds. One is that, despite the Gov’t urging people to spend more money that they don’t have to jump-start the economy, people are smarter than that and are starting to save more and pay off debt – which is exactly what they should be doing. I think another is the U.S. food production capability – at least we should always be able to feed ourselves, as well as having a key export. Now the bad news. The Gov’t, with their Keynesian stimulus, as well as bailouts, is artificially manipulating the business cycle, which is never good, and usually leads to inflation. Interest rates have been far too low for far too long, weakening the dollar and giving rise to a morale hazard environment with all the leveraged asset bubbles that have been bursting, and the unsound financial derivatives. The Fed has doubled (yes, doubled) the monetary base within the last year, which will lead to inflation. Worst of all though, to me, is the national debt and continuing deficits into the forseeable future. Whatever green shoots that might be starting will be ripped from the soil by Uncle Sam, who, given the rise of socialist policies, will continue to take money from the productive sector and transfer it to the unproductive sector, not to mention to pay for the interest on the debt, which is approaching $1 billion per day. And how about our unfunded obligations to Social Security, Medicare, Medicaid and civil service pensions? I’ve heard estimates from respected sources that these amount to anywhere from $40-100 trillion. We don’t have it. What I’m trying to say is, no matter whether the fundamentals of the economy try to get on their feet, unless the Government radically overhauls our enitre entitlement system, and balances the budget I don’t see how we get out of this mess.