The Labor Department reported today that initial claims for unemployment insurance rose by 27,000 in the most recent available week. Although that’s a disappointing development, it’s still a small enough increase to allow the 4-week average to fall for the second week in a row. Since that declining 4-week average is one of the few encouraging pieces of news in an otherwise discouraging economic landscape, I wanted to take a closer look at just how significant a statistical signal it really sends.
The interest in the 4-week average of new claims for unemployment compensation results from
the observation by Northwestern Professor Robert Gordon that, for each of the last six recessions, once the new claims number began declining from its peak value, the NBER subsequently dated the recovery from that recession as beginning within 8 weeks.

|
Here’s a close-up of the behavior of the series so far in 2009, with the raw weekly numbers in black and the 4-week average in blue.
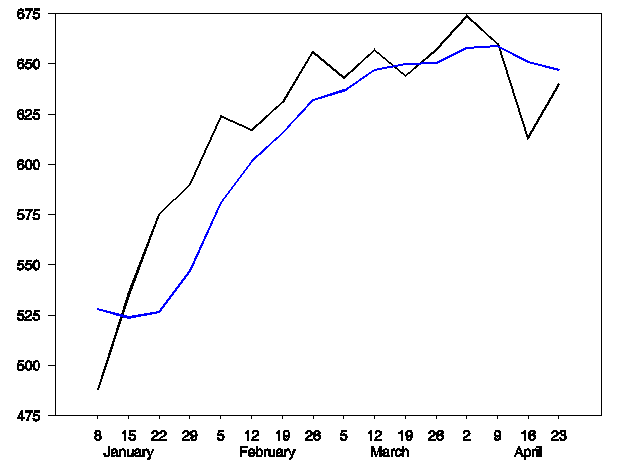
Will the latest downward move prove to be the beginning of a recovery, or will we turn around and head back up to a new high? Let’s try to pose this as a statistical question. We’re trying to figure out whether the number for the 4-week average that was reported two weeks ago will turn out to be the highest value of this recession. Let st equal 0 if week t turns out to come before the peak value for the recession, and st = 1 if it turns out we’re past the peak. Of course we don’t know now which is the case, but if t represents a week from one of the previous 6 recessions, we now know enough to assign a value of either 0 or 1 to that week. There are 278 of those earlier observations on st from the recessions of 1970, 1974, 1980, 1982, 1990, and 2001.
The question we’d like to ask statistically is the following. Let’s take it as given that we’re currently in a recession. Let yt denote the observed two-week percentage change in the 4-week average as of week t. The latest observation is a 1.8% decline, so the most recent value is yt = -1.8. We’d like to calculate the probability that st = 1 if we’ve seen a 2-week decline in yt as big as 1.8%, that is, we’d like to find the value of

From the definition of a conditional probability, this can be found by dividing the joint probability by the marginal probability:

We know the denominator of this fraction by looking at the number of those earlier known recession weeks between 1969 and 2001 for which we observed a 2-week decline in the 4-week average for new claims of 1.8% or more. It turns out that there were 46 weeks as favorable or more so as our most recently available datum:

To get the numerator, we count how many of those favorable declines proved to be the real McCoy. The answer is, 17 of them were part of the eventual trip down and out of the recession, but the other 29 represented temporary relief on a path that would eventually reach a new peak before turning down. The answer to our original question of interest, namely what’s the probability we’re on our way out of the recession this time, is thus given by

In other words, there’s a 63% chance that new unemployment claims will go back above the recent peak before they finally start to head back down.
The key factor that leads to this pessimistic assessment is the fact that we’re conditioning on the knowledge that our current week t is definitely still part of the recession, which seems to me an entirely safe bet. Given that we are in a recession, that fact in itself would lead you to expect to see new unemployment claims go up rather than down (as they did in the vast majority of our 278-week earlier sample). The fact that we’ve seen the average decline for a couple of weeks now isn’t enough to get you to change your mind, if you’re convinced that as of right now the recession has not yet ended.
What would it take to get you to change your mind? A 2-week drop of more than 3.4% would bring the probability above 0.5. But you’d never get much more confident than that based on this line of reasoning, because you’d always be factoring in the possibility that we’d see a repeat of the big drops in new unemployment claims that were observed in the 1970 and 1974 recessions, which ended up being followed by even bigger increases. The fact we’re conditioning on for these calculations– that we’re currently in a recession– is by itself a strong enough predictor that future unemployment claims are headed higher that you’d never be completely sure the peak is behind us based on just a few weeks worth of decline.
In other words, you’d never be completely persuaded, if the only variable you had to look at was a few weeks of unemployment claims, that a recession is just about to end.
The latest number might turn out to be a green shoot, no question. But the odds are two to one that it’s just another dead twig.
Technorati Tags: employment,
recession,
macroeconomics,
economics
I noticed you started your graph in January, which may present a slightly exaggerated view of the rise this year, as there was a dip from mid-Dec to the beginning of Jan from around 550K to 500K for a couple of weeks.
That was certainly one of your dead twigs, but if you take the trend from mid Dec onwards (ignoring that twig) then the present flattening looks flatter.
Recovery? My guess – not in the typical sense of ‘things back up to normal.’ More likely, merely a cessation of things getting worse, but sort of staying where they are (with rather minor ups and downs) for quite some time (years).
What if you assume the opposite, i.e., we are not in a recession. Would a transition point between the two probability lines be a better indicator?
Well, have you factored in a large scale event, like the effect of messy and protracted GM and Chrysler bankruptcies?
tyraesun: Yes, if you conditioned on being in an expansion, the inference would go in the other direction– given that in an expansion you expect the number to be falling anyway, the observation of a 2-week decline makes you expect that even more. The reason I instead condition on the assumption that we’re currently in a recession is because I’m personally certain that we are.
Jim: The calculations don’t condition on any expected future event, but simply summarize what you’d predict based on the historical average. If you have some other event anticipated that would make you more pessimistic, obviously that would make the probability smaller. I’m asking here just what’s the nature of the evidence in the unemployment claims numbers themselves.
Watch it, those numbers were post-holiday at the first half of April which is a known slack in claims adjusted. That will always lower those numbers, but they will continue to amp to May when they hit 700,000+.
This analysis should be extended to account for seasonal adjustment problems in the data. In particular, even after seasonal adjustment, claims tend to fall in January and July. The reason claims tend to fall in January is because they often rise around the Christmas and New Year’s holidays. The reason they fall in July is because summer shutdowns at auto plants cause a spike at the start of the month that is then unwound. I think you will find that about 50% of the declines larger than 1.7% that are not associated with the end of a recession (i.e. false signals) come in those two months.
Uhhhh…
I just downloaded the data and graphed them out myself, and looking at the 1982 recession in particular I see four peaks on the way up before the final one from which the descent heralded the recessions end. Yes, using 20:20 hindsight to pick the last and highest peak in a particular recession’s curve, you can show that the recovery starts a few weeks later, but there’s no particular reason to think the current peak is the last of this recession.
jm: That’s exactly the statistical problem I just analyzed.
James, I’ll do you one better:
Given recent trends, it seems somewhat probable that even the current week’s initial claims number gets revised higher still (just as last week’s has).
Getting back to the prior recessions, tho – maybe I’m really missing something, but it appears to me that the first (and highest) initial claims peak during the 1969-70 recession occurred many months prior to the NBER-defined trough, no? (I see two peaks, one a little bit larger — and far earlier — and then one, slightly smaller, just before the NBER-defined trough).
As for comparisons with the present downturn, 1969-70 was a classic double-dip recession, which doesn’t always happen. BUT, who in their right mind truly believes that when the current recession formally ends and recovery begins, the recovery from this booger is going to be fail-safe?
My predictions, unchanged since December :
1) Q309 NBER trough
2) Jobs bottom at 131M (so 2M more to go)
3) UE rate tops at around 10.5%
4) Jobless recovery into 2010
In the spirit of Jim Hamilton’s analysis above, we can also condition on a string of decreases in the 4-week moving average in initial claims for unemployment insurance. Straighforward calculations show that the estimated probability of a decrease conditional on three immediately preceding decreases is 0.50; conditioning on either four or four immediately preceding decreases yields the same estimate (to two decimal places). So, conditioning on such a string of decreases, whether another decrease occurs appears to be a coin toss.
ciel: You’re right, the 4-week average was higher on May 14, 1970 than it was on October 22, 1970, and I used the latter as the definition of the peak. However, if you used the earlier date as the definition of the peak, the claim that the recovery always follows the peak within 8 weeks would no longer be correct– the 1970 lag would be 29 weeks. If you like, you can interpret the probability I report as the probability that the most recent 2-week decline signals that the recovery from the recession is imminent. Alternatively, if you choose to leave the 1970 recession out altogether, the calculated probability that our current observation signals that the peak is passed increases from the 37% if you include 1970 to 43% if you exclude it.
Professor,
Why do you never mention the government and the effect of its decisions when you post this kind of article? The government is the elephant in the living room. Everyone knows it is there but they totally ignore or just keep stepping around the piles it leaves.
If the government makes a decision that will throw people out of work statistics are less than meaningless.
Uhhhh…
I just downloaded the data and graphed them out myself, and looking at the 1982 recession in particular I see four peaks on the way up before the final one from which the descent heralded the recessions end. Yes, using 20:20 hindsight to pick the last and highest peak in a particular recession’s curve, you can show that the recovery starts a few weeks later, but there’s no particular reason to think the current peak is the last of this recession.
JDH,
“jm: That’s exactly the statistical problem I just analyzed.”
My apologies. I encountered this post after a long, hard day and after having read the previous post on the subject, and didn’t wade through the wonderfully thorough analysis you gave it this time.
the trends of initial claims are useful. But there is also change in the levels of continuing claims. they are the water in the pail compared to the water going into the pail. continuing claims are reduced by people hired or otherwise no longer receiving benefits. The monthly change (increase) in the continuing claims ran in the 300k s since Nov. only a quarter or less of the monthly gross new weekly claims amount. Then continuing claims growth accelerated the last two months to more like a 500-600k range. Payroll and the unemployment rate have not respnded yet but still may.
Thanks for the stats analysis, professor.. loved it!
Looking at the chart of initial claims, I am struck by how large the spike was for the 1981-1982 recession, considering that the work force was considerably smaller (around 100MM versus around 140MM or so now). I very rarely hear any comparison of the current downturn to 1981-1982, perhaps because the solution wasn’t massive spending on make-work projects, but rather tax cuts.
@ Rich Berger
Rich, the “solution” for recovery from the 1981-82 recession was mostly reduced interest rates (taking the foot off the inflation break, as it was).. and not the Reagan tax cuts. This meme that the “tax cutting was the cure” is a myth that gets brought up again and again by people with an agenda.
As for the Initial Claims data being so much higher in 1981-82, a much higher percentage of the American workforce back than than today *could apply* for Unemployment Insurance. That was back in the day of a much larger manufacturing base, for example… (compared to these days, the days of a much larger “freelance” and “1099” base, if you will).
This comparison with the 1981-82 IU claims is yet just another canard that gets dragged out by those with an agenda.
AWH, regarding continuing claims. After 6 months or so, you no longer can receive benefits and drop off, is that correct? So in an extended recession, even continuing claims may lose its usefullness. This is why my favorite employment metric is the household survey.
Ciel-
Nonsense – care to provide support for your claim that there were so many less eligible to apply for unemployment? Say 40MM?
Continuing claims is a lagging indicator and is pretty much useless anyway. The first sign of improvement will be in initial claims.
The fact that this sort of fall in initial claims for unemployment insurance has happened 46 times in the past, and that 17 of those times it was part of the climb out of recession, is very interesting.
However, I think it’s a bit unjustified to say “there’s a 60% chance the claims will go back up above this”. At least, not with more evidence that these past data points are predictive of today’s, unemployment insurance claims can be treated as a random variable like this, etc. I’m not really sure that you can use probability this way.
That said, I think you’ve made a pretty convincing case that this good news is not a slam dunk that we’re free and clear just yet.
Rich, the percentage of the workforce that is generally eligible for UI benefits today is considerably less than it was in the past. This should become painfully obvious to anyone who looks squarely at the trends in the data. Here are some links for your consideration:
http://www.questia.com/googleScholar.qst;jsessionid=Jy6Zv7Q7FQHyJTM1tGYLln9TGYSk66fQpNhLfb7hhnJkGbQ1k3JC!1021319444!-1137335696?docId=5001652741
http://curiouscapitalist.blogs.time.com/2009/02/17/modernizing-unemployment-insurance-for-a-1980s-economy/
http://www.bls.gov/news.release/empsit.t12.htm
http://tiss.zdv.uni-tuebingen.de/webroot/sp/spsba01_W98_1/usa6d.htm
http://www.cbpp.org/cms/index.cfm?fa=view&id=2221
According to the BLS, annual employment was approximately 10.7 MM in 82-83. That recession was considerably worse than the current one, but for some reason is ignored. Could be that it doesn’t fit the current administration’s pro-spending agenda.
ciel-
I checked all your links and none of them support your contention. In fact, the second to last actually undercuts your argument as the percentage covered by UI in the early 80’s is not substantially different than the percentage at the end of the chart.
Cheers
Rich, I suppose one can look at the data and read into it whatever one is predisposed to. I read these stories, and look at the numbers, and I find that, on the whole, from the late 1970s on, smaller percentages of working Americans qualified for UI, than in recessions in the 40s, 50s, 60s, 70s, and yes, also in some regards, the two recessions of the early 80s.
I do not claim to suggest that the 1981-82 recession was not a doozie. Just that the current recession is worse, and that unfortunately, given trends in employment over the decades, U6 is running higher today than similar measures at the two peaks of the 80s recessions (try claiming unemployment when you are only working “part time”)… and also that a smaller share of working Americans than during the more robust manufacturing economies of the 70s and early 80s.. hold jobs in general that inherently lay off and rehire quickly, such that initial claims are snapped right up and handed out, as so many would be back on the job once the downturn abates.
That the second to last undercuts my argument is of no concern. I readily admit that not all of the research and data upholds my pov, and some of it even challenges it.
My perspective remains the same, however. (The trends of the last 30 or so years has lowered the percent of working Americans who qualify for and/or step right up to apply for UI).
Mike R/ Steve
think you missed my point.
Which is that the rise in continuing claims now equals/exceeds the monthly payroll loss. it has always been less than payroll loss in past recessions. this is logical as many newly unemployed do not qualify for benefits. and as you point out mike people still unemployed drop off rolls. so why is the payroll loss so small compared to recent continuing claims gains?
http://www.voxeu.org/index.php?q=node/3524