The Analytical Perspectives of the FY2010 budget have been released. Imbedded in the document are the Administration’s new forecasts placed in the context of newer forecasts from CBO and Blue Chip [text added 12:30] (see the Chapter on Economic Assumptions). They have also provided some insights into the sensitivity of the budget outlook to specific alternate economic scenarios (not something I recall the previous Administration doing, but I might be wrong), as well as coefficients of revenue and expenditure sensitivities (something done in previous Analytical Perspectives).
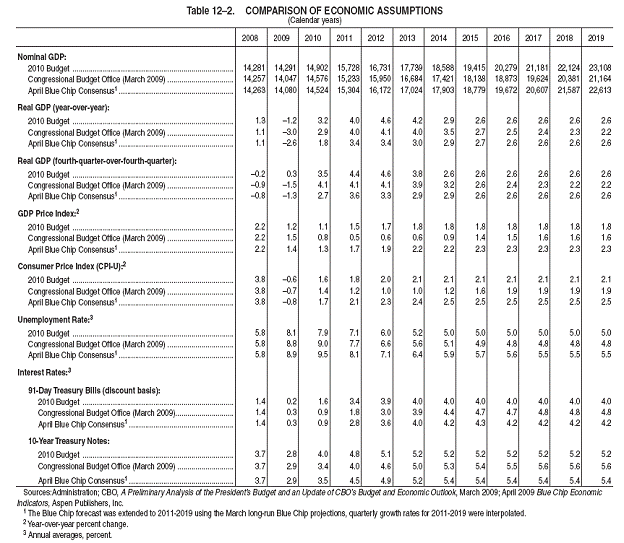
First to a comparison of the Administration’s economic outlook against the CBO’s and the most recent Blue Chip.

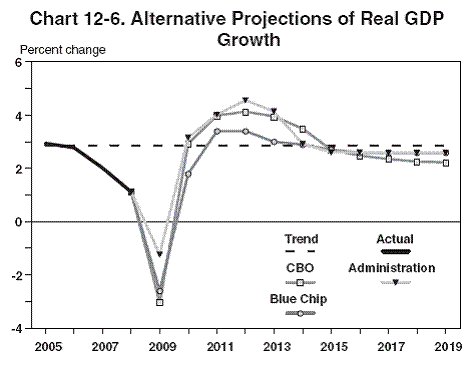
The differences are graphically depicted in Chart 12-6:

Note that the Administration is more optimistic than CBO (in March) and the Blue Chip mean survey. However, as I’ve discussed in a previous post, I suspect that the difference is not statistically different even using the 50 significance level.
The Administration also provides some sensitivity analysis to differing economic outlooks, in Table 12-5 (see Table 12-4 in the section for coefficients).

The Alternate Scenarios 1 and 2 are described thus:
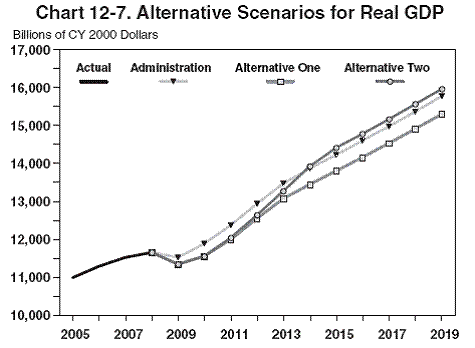
In the first scenario, growth in 2011-2014 is the same as in the current Administration forecast. In this case, there is a permanent loss of output from the recession that is never made up in the subsequent recovery. The loss is less than in the latest Blue Chip projections, which only show a modest and very partial recovery from the recession, but there is a substantial loss compared with the Budget as shown in Chart 12-7.
The second alternative scenario makes a different assumption about the recovery period. It assumes that over the five years from 2009 through 2014, growth is equal to the average growth rate achieved in the expansions that followed most of the recessions since the Great Depression as reflected in Chart 12-7. The average real growth rate following the trough of these recessions has been 4.2 percent. With that type of recovery, the level of real GDP would be higher in 2014 than in the Administration projections and budget deficits after 2014 would be lower than under the Administration’s projections as shown in Table 12-5.
Chart 12-7 is shown below:

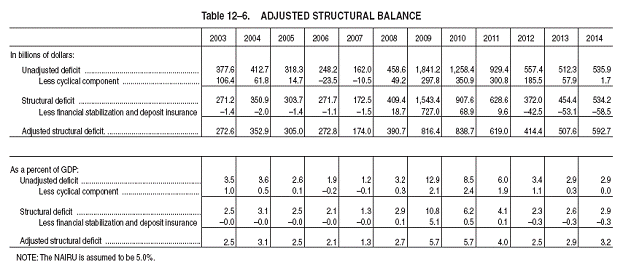
Finally, I’ve noted that the best measure of fiscal stance is the cyclically adjusted or “full employment” budget balance, expressed as a share of GDP. The Administration’s forecast for this series is presented in Table 12-6.

One has to keep in mind that the manner in which the OMB and the CBO calculate the cyclically adjusted series differs, so for full consistency, we’ll have to wait and see how the CBO historical measure compares against the updated CBO assessment (I’m sure there’s a number floating around out there, but I don’t have access to it…).
I’ll note at this juncture that CY2012 figure is smaller (in absolute value) than the corresponding CY2004 figure. Of course, the difference is that CBO is projecting an output gap of something like 6% in that year, and the output gap in 2004 was around 1%.
By the way, over at the CEA, they’ve released an updated assessment of how the Administration traces out its predictions for the impact of the ARRA on output and employment.
For additional discussion, see OMBlog, Bloomberg, WSJ. Regarding the budget itself, see Economist Mom.
Why would the 2008 actual GDP growth be different between the Blue Chip and 2010 budget? Seems like a timing issue which implies their forecast is now out of date.
As far as the degree of differece from the Blue forecasts, I have not done a significance test but only one Blue Chip forecaster is more optimistic in 2009 and 2010.
GWG: It turns out the forecasts in the Analytical Perspectives are the same ones released at end-February, so they Administration forecast is based on end-January data, while the CBO and Blue Chip are based on more recent data (including later releases of GDP for 2008Q4).
In an earlier post, I compared the Administration forecast against the WSJ survey available at that time, and came to the conclusion I did. It’s probably the case that the Administration forecast from February is different from the Blue Chip (and WSJ) surveys that are out now.
So the CBO estimates are based on about 3 years of 4% GDP growth, unemployment to max out at 9%, CPI in a steady (positive) 1%-2% range for a decade, and 10-year T-notes to yield no more than 5.6% for the coming decade?
Good luck with that. Let me know how that works out for you.
Obama has an unusually optimistic assessment of his own abilities if he thinks he can sustain 4.5% GDP growth all the way until his next election.
It will interesting to see what happens when reality is closer to the blue-chip consensus than Obama’s hopes.
Great post! We linked it on http://www.newdeal20.org.
I am always impressed (ok, flabbergasted) with the ability to project (eg Chart 12-7) a decade in advance…with such precision (those alternative scenarios (which exclude the meteorite scenario which puts the planet in an Ice Age 2013).
I need to see their past performance, esp those 10 yr projections starting from 2000, to give these numbers the academic weight they deserve.
No, it’s worse than that.
The solid, thick line leading up to 2009 as it takes that gentle crest down? Taking my lead from the concept of “now casts”, I have this great urge to pencil in something significantly lower for these values…as all that housing stock and associated financial servicing was improperly registered.
There were no swimming pools after all: only mosquito ponds.
I don’t know if Ironman is going to comment, but he has a post summarizing the effects of Obama’s policies so far at – http://politicalcalculations.blogspot.com/2009/05/pouring-taxpayer-money-down-drain.html
Not a pretty picture. Not a smart man.
Actually long range forecast usually turn out to be more accurate than short run forecast. Long run forecast are simple. If large scale excess capacity exist you forecast above trend growth as the GDP GAP is wide and slowing to trend growth as the GDP GAP closes.
Generally, the consensus forecast of economic growth in recoveries is too weak. It is a very strong trend. In 1981 I won the NABE forecasting contest by forecasting that the rebound out of the 1980 recession would display average growth for a recovery. It was the strongest forecast in the competition.
It seems unlikely to me that real growth will match the trend as shown, especially in light of energy markets and calmo’s point that the 2005-2008 growth is probably based on overstated output values. Where will future valuable output come from? Agriculture?
For those of you who like comedy notice “QUESTIONS AND ANSWERS ABOUT THE GOVERNMENTS STEWARDSHIP” starting on page 185. I have posted the question and the first part of the response. This is hilarious!!
1. According to Table 131, the Government’s liabilities exceed its assets. No business could operate in such a fashion. Why does the Government not manage its finances more like a business?
The Federal Government has different objectives from a business firm.
2. Table 131 seems to imply that the Government is insolvent. Is it?
No. Just as the Federal Governments responsibilities are different from those of private business, so are its resources. Government
solvency must be evaluated in different terms.
3. Why are Medicare, Medicaid, and Social Security not shown as Government liabilities in Table 131?
Future Medicare, Medicaid, and Social Security benefits may be considered as obligations of the Federal Government, but these benefits are not a liability in a legal or accounting sense.
4. Why doesnt the Federal Government follow normal business practice in its bookkeeping?
The Government is not a business, and accounting standards designed to illuminate how much a business earns and how much equity it has could provide misleading information if applied naively to the Government.
Rich Berger: This is not a convincing post; the mean forecast of professional forecasters as of January 2009 turned out to be too optimistic. As you well know. Furthermore, credibility of the post is decreased as it cites as authority on this issue Greg Mankiw, when we know he has had two opinions on the job criterion, at two different times — see here.
Dick Fox: Well, the government isn’t a business. Libertarians believe that government operations should be limited to things like the administration of justice, yes? But that’s not a profit making operation — or shouldn’t be in my book. Maybe it is in yours.
Call me nuts, but I think both Mario Sanchez and Spencer above have valid points, and for the same reason: This recession is unusual (& unique in our lifetimes) in that it is being driven a major global financial crisis as opposed to classic supply-demand imbalance business cycles.
Like these more normal cycles, Spencer rightly captures the fact that economic models have a hard time picking a turn and its vigor. In my view, this is largely because they are (& almost have to be) driven by historic data, which tends to stick to the trend of the moment. It is why we keep seeing forecasts of this recession’s bottom and recovery being extended lower and later.
It is the unique financial dimension of this recession that make Mario’s comments so on point over the longer term. We have no good historic experience on which to make a sound economic (as opposed to political) judgment that the recovery will be vigorous or “V-shaped” when it occurs. Moreover, it is extremely difficult to assess the impact of the extreme monetary and fiscal policies we have taken to address the crisis.
As for me, I think Mario’s skepticism is closer to the long-term mark. It will take years and much inflation to work our way out of this economic mess.
I wonder where the low multi-year growth forecasts are coming from? Esspecially in light of very large fiscal stimulus and truly enourmous (as measured by monetary base growth) monetary easing.
Obviously, they are supposed to reflect the effects of the financial crisis on the credit channel, and in the case of the monetary easing the effects of the lower bound on short interest rates.
Being cynical, I think the growth estimates come taking the output of forecasting models that take no account whatsoever of the former (ie they don’t even have a credit channel) and a simplistic account of latter (they do not have money or interest rates other than the short rate), then making ad hock adjustments to the model outputs, reflecting the subjective judgements of the model operator.
If this is the case, we should take the forecasts with a large pinch of salt.
– Tim
Menzie-
I will ask again – can you give us an historical example of a successful stimulus program?
BTW – The Obama stimulus is a fraud. Most of the money is to be spent (er wasted) too far out to do any good now.
Menzie wrote:
Dick Fox: Well, the government isn’t a business. Libertarians believe that government operations should be limited to things like the administration of justice, yes? But that’s not a profit making operation — or shouldn’t be in my book. Maybe it is in yours.
Menzie,
This is one of our primary differences. The government can not make a profit. It is a cost. It confiscates profits. I believe this is well illustrated in the answers to the questions posed above.
Rich Berger: See table p.165 in Ch.5 of Fall 2008 WEO, as well as Edelberg, Eichenbaum, Fisher (working paper version; published version in Review of Economic Dynamics).
By the way, how’s that guess from October 21, 2007 on housing values going?
Menzie-
I can’t get access to the NBER paper but the intro to the other resource says “New evidence presented here, from emerging as well as
advanced economies, indicates that the effects of fiscal stimulus can be positive, albeit modest. But policymakers must be very careful about how stimulus packages are implemented, ensuring that they are timely and that they are not likely to become entrenched and raise concerns about debt sustainability.” I think it’s quite clear that the current stimulus was recklessly adopted and not carefully implemented. Its purpose is to entrench certain programs and permanently raise the cost of government.
Scanning through the document, I do not see any evidence that stimulus is more than modestly effective (if effective at all).
My October 21, 2007 housing guess? I see my comments to posts in that time frame, but no hard predictions that I can find. Be more specific and I will give you an honest answer.
Rich Berger/Anonymous 10:34: To quote from your comment regarding housing prices, in comments of 21 October 2007:
Case-Shiller 10-city index is already 28.3% below peak (33% in log terms); futures indicate a trough at 41.3% (53.2% in log terms).
Regarding fiscal policy, your definition of success is different than mine, I suspect.
With a little research, you could’ve found this link to the paper.
Yea, just like the other comments I agree that economic forecasts are always questionable and based on different assumptions, no matter how outlandish. I myself have been tracking the real estate market in my area San Diego real estate I find that local economists tend to be more bias, but also tend to make less mistakes since they know their area better then most.
Menzie-
Re your cite: what post was I commenting on in Oct 2007? I can find comments but not that one, so I don’t know the context.
Rich Berger: Here’s the link to the 21 October 2007 comments (the specific comment comes in at 22 October, 9:07 am).
Menzie-
The OFHEO index (now under HFHA I believe) peaked at 386.14 and was at 368.28 in 4Q 2008. There are of course methodological differences between that index and the CS, but even your 10 city index was down about 30% from peak (from what I can find). I believe that the 10-city CS overstates decline because it focuses on cities that experienced high appreciation and rapid depreciation. I stand by my prediction.