A month ago, I examined the information content of the OECD’s Composite Leading Indicators. The August release (for June data) is out. There’s substantial variation in the implied outlook across economies.
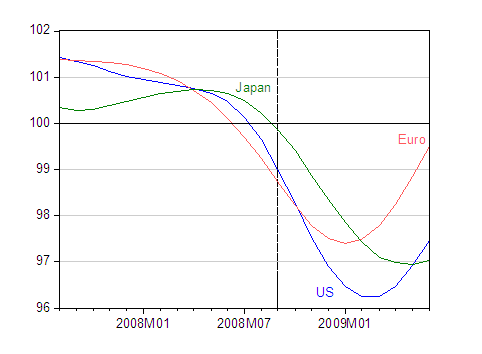
Figure 1: Normalized Composite Leading Indicators for US (blue), euro area (salmon) and Japan (green). Above 100 indicates expansion, below contraction. Dashed line at 2008M09, at the financial crisis. Source: OECD.
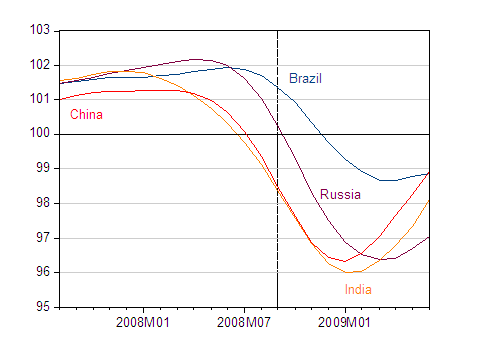
Figure 2: Normalized Composite Leading Indicators for Brazil (dark blue), Russia (purple) and India (yellow) and China (orange). Above 100 indicates expansion, below contraction. Dashed line at 2008M09, at the financial crisis. Source: OECD.
The documentation for the CLI are here, while an econometric evaluation of the CLI by Fichtner, Reuffer and Schnatz is here.
Notice that indeed things are looking up in the BRICs (Brazil, Russia, India, China), with perhaps the exception of Russia. Or, more accurately, things are looking less bad in those countries.
To keep things in perspective, 2008 US GDP (evaluated at market exchange rates) was about 23.5% of world GDP (all ratios from April 2009 IMF World Economic Outlook database), while these three economies in aggregate accounted for 54% of world GDP. The BRICs accounted for 14.6%. China is 7.3% of world GDP, so even with growth resuming, something else will be needed to get world growth back to near normal rates [1].
Update, 6pm Pacific: Interestingly, Japanese GDP has surged into the positive, ahead of the CLI; while not unexpected, there is a question whether the growth is sustainable.
The previous leading indicator
The leading indicator used until now for the United States in the OECD system was made up of the
following nine series:
1. Housing starts;
2. Money supply M2, CPI-deflated (1975 prices);
3. Treasury bill rate;
4. Share prices (Standard & Poor’s);
5. Net new orders, durable goods;
6. Average weekly claims for unemployment benefit;
7. Changes in crude materials prices and sensitive prices, smoothed;
8. Changes in credit (business and consumption);
9. Net business formation.
The last two series were suspended
The predicting power of the OECD, LEI is undisputed and the correlation is high when anticipating the businees cycles,but few caveats:
Many of the components are man made that means can be heavily influenced through prices distortions with a future hidden cost not factored in the LEI or the quality of the business cycles not being reflected properly (short term growth vs long term growth potential)
Few samples Stock markets, treasury rate, CPI, average weekly unemployment….
thanks for this blog.
A minor point. The greenback trades well above PPP wih most currencies, so US share of world production is, on a PPP basis, rather less than 23% – proably around 20%. Given the undervaluation (relative to PPP) of BRIC currencies their share is probably considerably more than 15%. All in all, combined BRIC GNP is probably only a bit smaller than the US’.
Menzie,
A quick inspection of Japan’s GDP figures for 2Q09 indicate that though there was growth in private household consumption and real exports, residential investment is still in a freefall, and GDP growth had a lot to do with public investment and declining real imports. I’d say one apparently good quarter of GDP growth is insufficient to call an end to Japan’s downturn. Likewise for the euro area 2Q09 rebound; Data is lacking for the components of aggregate final demand. But public consumption and investment likely had a positive impact on the positive numbers for Germany and France, and declining imports may also have played a significant role in the uptick. There too, I’d say its too early to call the end of the recession.
Menzie wrote:
The BRICs accounted for 14.6%. China is 7.3% of world GDP, so even with growth resuming, something else will be needed to get world growth back to near normal rates.
Think about this sentence a moment.
The implication is that there is no meaning to recover unless there is world recovery. But what about those countries such as Germany and France who are actually seeing growth in their economies? Are you saying that their growth is meaningless to them?
What about Zimbabwe? If the rest of the world booms will that change things in Zimbabwe?
This is a reflection of the strangeness of aggregate thinking and econometric thinking. What actually will lead recovery the end of stupidly destructive government policy or good numbers? I hope you understand that numbers follow policy they do not lead it.
Aggregate number are nothing but the sum of individual units. If the units succeed the aggregate will succeed. If the units fail the aggregate will fail. Contrary to modern economic thinking you cannot save in aggregate. You save one economy at a time.
Aggregate policies only socialize costs resulting in prolonged and more far-reaching failure.
Interesting post.
“. . .so US share of world production is, on a PPP basis, rather less than 23% – proably around 20%. Given the undervaluation (relative to PPP) of BRIC currencies their share is probably considerably more than 15%. All in all, combined BRIC GNP is probably only a bit smaller than the US’.”
What does this have to do with the topic at hand, other than a desire to downplay US share of world production? (What is the point of picking out U.S. PPP GDP rather than Euro or Japanese GDP, or all together?) The world does not trade in PPP dollars.