The new semester has begun, and I was reviewing economic trends in my macro courses. In my lectures, I highlighted the sharp drop-off in consumption. In the following, I discuss how well my predictions for consumption from last November have held up.
First, a recap of events:
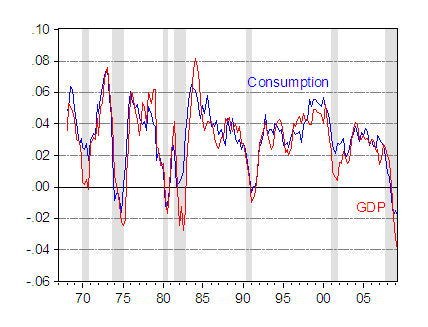
Figure 1: Real consumption year-on-year growth (blue) and real GDP year-on-year growth (red), calculated as 4 quarter log differences. NBER defined recession dates shaded gray. Source: BEA, GDP 2009Q2 second release, NBER, and author’s calculations.
Figure 1 shows how the year-on-year growth in consumption has hit very low rates, lower than at any period in the past forty years. So too has GDP growth (where now are all those people who were denying the depth of the recession, e.g. [0]?).
In Figure 2, I show individual component year-on-year growth rates. (Durables, nondurables and services are 10%, 21.8%, and 68.1% of nominal consumption, respectively.)
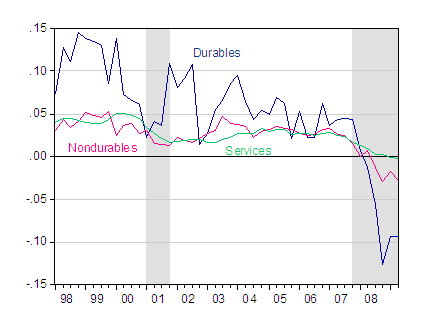
Figure 2: Real durables consumption (dark blue), nondurables (pink) and services (light green) year-on-year growth, calculated as 4 quarter log differences. NBER defined recession dates shaded gray. Source: BEA, GDP 2009Q2 second release, NBER, and author’s calculations.
A log-levels depiction of aggregate consumption is of interest. In Figure 3 I show the log level of real consumption (blue line), converting consumption measured in Ch.2005$ into Ch.2000$ (I use the ratio of the base year 2000 and base year 2005 deflators in 2000 to convert one to the other).
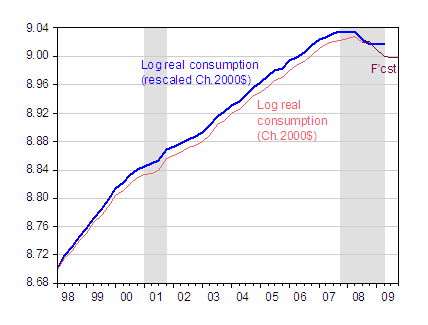
Figure 3: Log real consumption in rescaled Ch.2000$, most recent vintage (blue), log real consumption in Ch.2000$ (red) and Nov. 13, 2008 forecast (purple). NBER defined recession dates shaded gray. Rescaled by using ratio of PCE deflator in 2005 to 2000. Source: BEA, GDP 2008Q3 preliminary release, GDP 2009Q2 second release, NBER, and author’s calculations.
What is clear is the drop in consumption has been marked, especially when measured against the upward drift observed before the crisis. I’ve included consumption series reported in the October 30th GDP release, as well as my forecast from my November 13 post. In that analysis, I used error correction models assuming long run cointegration between consumption components (durables, nondurables, services), GDP and equity and nonequity wealth to forecast out-of-sample assuming certain paths for GDP and wealth.
It’s hard to tell (because the benchmark revisions added to the level of consumption, as they did to GDP [1]), but the actual decline from 2008Q2 to 2009Q2 was 1.8% (log terms), vs. my prediction of 2.8%. This is a little surprising since GDP had decline 4% instead of the 1.6% assumed, and from 2008Q2 to 09Q1, real net worth had declined by 15.8% instead of 15.1% I assumed.
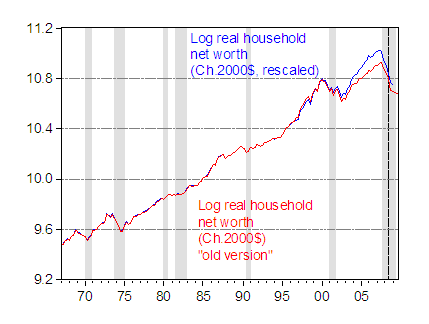
Figure 4: Log real household net worth in Ch.2000$, latest vintage (blue), log real household net worth in Ch.2000$ from November 2008 (red); red series observations after dashed line are November 2008 forecasts. Series deflated by PCE deflator. NBER defined recession dates shaded gray. Source: Federal Reserve, Flow of Funds, BEA, NBER, and author’s calculations.
Of course, I used a particularly simple model of consumption, where the key determinants were equity and nonequity wealth and GDP. The difference in behavior between GDP and disposable income (keeping in mind the tax rebates in 2009Q2) might account for the higher than predicted consumption (expressed relative to 2008Q2). Using Romer’s estimates of $40 billion in rebates tax rebates, Economic Recovery Payments, Unemployment Insurance and Food Stamps [thanks to M. A. Sadowski], an impact multiplier of 0.5, and (unlike [2] and [3]) remembering to use consumption at quarterly rates, one finds that this effect could account for 0.9 percentage points of the 1.0 percentage point mis-prediction (although if I went through the trouble of updating the forecast to account for the actual evolution of GDP and net wealth, I’d have a bigger gap to account for).
Update, 9/10/09, 5pm Pacific
The CEA has released its analysis of the impacts of the ARRA. Below is Table 2 from the report, which breaks down stimulus funds to date, by functional categories.
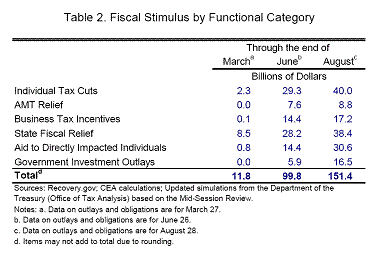
Table 2 from CEA, The Economic Impact of the American Recovery and Reinvestment Act of 2009 First Quarterly Report, September 10, 2009.
Hi Prof Chinn,
I’d like to make a request. I was wondering if you can do an in-depth analysis on inflation for the next couple of years? The economy seems to have bottomed. Looking forward, we still need to navigate the recovery. Given the huge fiscal stimulus, the loose monetary policy and the various QE programs, a major concern is inflation. Can you help us get a better understanding of inflation prospect in the US and around the world?
OK, in order to make an out-of-sample forecast of consumption we have to assume a certain path for GDP & wealth; I am really sorry, but how can we define that result a Forecast? I think its just a projection, based on our discretional judgment. We should try to model endogenously GDP & Wealth.
Consumption of durables is now well below trend.
The two questions this raises.
One, is the old trend still relevant ?
If not what is the new trend?
Two, what is the normal pattern of returning to trend?
How should this rebound compare to previous return to trend patterns?
Menzie,
Just curious. How did your November 2007 forecasts hold up against 2008?
juan: Well, when I first learned econometrics, we called what I did a “conditional forecast”. Admittedly, that was a long time ago. Perhaps the terminology has changed, and if so, I stand corrected. I am happy to let you take up the challenge of estimating a simultaneous system of equations to jointly forecast all three variables, and would very much hope you could share the results with all of us.
DickF: I didn’t provide a numerical forecast, but here is what I wrote in a November 15, 2007 post:
Menzie Chen,
Looking at table 4, one gut feel forecast I can make, without resorting to setting up some iterative loops on my computer (surely a waste of time anyway), is that as far as households are concerned, we had a lost decade already when it come to household net worth. The chart indicates we are below the 1999 level. This was the peak of the tech bubble, and the chart data ends 11/2008, so current stock prices are higher, at least for now. Even so, it looks like we are not much above the 2002 low.
I would say that would be disturbing to boomers, who got 10 years closer to retirement age anyway. So after putting the kids thru college at say, $50K a head (including living expenses), seems to me we are headed for a secular bear in consumption, unless the echo boomers buy a hell of a lot of iPods and iPhones.
Also, I what is the actual dollar figure used for the y-axis on chart 4. I always see personal net worth, on a aggregate basis, quoted as going from a recent peak of $58 trillion to a current $50 trillion. This tracks with the 15% decrease you noted. But what table in Flow of Funds did your 9.2 to 11.2, prior to massaging, come from?
@Menzie,
Just to nitpick a little bit on the influence of the stimulus on consumption a little bit:
On July 8th in congressional testimony Robert L. Nabors Deputy Director of the OMB stated:
“As of June 30, almost $201 billion, or approximately 26 percent, of all Recovery Act funding had been obligated or distributed. This includes $157.7 billion of obligations, representing all major agencies-of which over a third has been outlaid-and $43.2 billion of tax relief.”
http://www.whitehouse.gov/omb/assets/testimony/deputy_070809_arra.pdf
So Romer understated the figure slightly. Going through the various tax expenditures that were immediately available about $27 billion of this were business tax cuts and incentives leaving only about $16 billion for individuals (Make Work Pay and various individual incentives). However there was about $27 billion in direct spending that were in the form of individual transfers (Economic Recovery Payments, Unemployment Insurance and Food Stamps).
In other words your $40 billion figure is approximately correct (actually it was closer to $43 billion) but less than 40% of that was actually in the form of tax expenditures.
Carry on.
Menzie, I think you have done a great job forecasting the economic crisis and the impact of fiscal policy over the past several years.
I am eager to hear your forecast for the next five years.
MikeR
Cedric Regula: Line 42, Table B.100 Balance Sheet of Households and Nonprofit Organizations of Flow of Funds. The vertical axis is in natural logs, as indicated in the notes to the graph; just take the anti-log.
MikeR: Thanks for the words of encouragement.